À propos du projet LANDSURF

Buts et objectifs

Le continent africain est confronté à divers défis et à de nombreux risques en raison du changement et de la variabilité climatiques passés et présents. Pour renforcer la résilience des sociétés ouest-africaines dans les secteurs de l'agriculture, de la sécurité alimentaire, de l'eau et de la gestion des risques, des mesures d'adaptation doivent être planifiées et mises en œuvre à temps. La planification et la mise en œuvre de mesures d'adaptation au changement climatique nécessitent des informations climatiques fiables et facilement accessibles à l'échelle locale et communautaire, adaptées aux besoins des différentes parties prenantes.

Dans ce contexte, le ministère fédéral allemand de l'éducation et de la recherche (BMBF) a financé un projet intitulé Land surface processes as a determinant of climate change in Africa (LANDSURF), afin d'identifier et de calculer des indices pertinents pour les parties prenantes africaines du secteur agricole. Le projet LANDSURF fait partie de la deuxième phase du plan d'action de recherche (WRAP2.0) du West African Science Service Center on Climate Change and Adapted Land-Use (WASCAL), qui vise à générer des services climatiques et environnementaux axés sur la demande pour soutenir la prise de décision par les décideurs politiques et les autres parties prenantes du secteur agricole. D'où le développement du système d'aide à la décision (DSS) pour l'agriculture, l'eau et la gestion des risques en Afrique de l'Ouest. Avant le développement du système d'aide à la décision, des ateliers initiaux ont été organisés à l'intention des parties prenantes, au cours desquels certains indices spécifiques à l'agriculture ont été présentés, discutés et validés. La liste d'indicateurs qui en a résulté a été utilisée comme variables cibles de la base de données du DSS. Les indicateurs sont liés à un large éventail d'aspects, notamment la température, les précipitations, la saison des pluies, la sécheresse et les indices agricoles. Sur cette base, nous avons comparé et sélectionné des données d'observation et de modélisation adéquates pour calculer les indices requis pour le passé (1981-2010) ainsi que pour trois périodes futures jusqu'à la fin du siècle dans l'hypothèse de deux scénarios différents d'émissions de gaz à effet de serre. Comme données de modèle, nous avons inclus des modèles avec des résolutions spatiales grossières et fines pour assurer une résolution à l'échelle des processus de décision régionaux et locaux. Ainsi, les données et les indicateurs du DSS peuvent servir de base à une prise de décision saine et éclairée sur les mesures d'adaptation à prendre pour faire face aux menaces du changement climatique. Pour mieux comprendre et interpréter les résultats, il est vivement conseillé aux utilisateurs du MAS et de ses données de lire la documentation qui suit.

Objectifs principaux:

  • Rendre les données obtenues dans le cadre du projet LANDSURF librement et facilement accessibles
  • Co-développement de la conception et du contenu avec les parties prenantes
  • Transfert, diffusion et distribution des connaissances, des informations climatiques et des données issues de la recherche
  • Permettre aux parties prenantes et aux petits exploitants d'intégrer les données et les connaissances acquises dans leur processus de prise de décision
  • Renforcer la résilience des acteurs et des petits exploitants d'Afrique de l'Ouest face au changement climatique

Partenaires du projet

Le projet WASCAL-LANDSURF est mené sous la direction de l'Institut de Géographie et de Géologie de l'Université de Würzburg, en Allemagne. Les autres partenaires du projet sont le Centre du Service Climatique d’Allemagne (GERICS), l'Institut des Géosciences et de la Géographie de l'Université de Halle-Wittenberg (Allemagne), l'Université de Ouagadougou (Burkina Faso), l'Institut des Ressources Naturelles en Afrique de l'Université des Nations Unies (Ghana), l'Université fédérale de technologie d'Akure (Nigeria) et le Centre Régional AGRHYMET de Niamey (Niger).

  • University of Würzburg

    Germany
    Nom Discipline
    Prof. Dr. Heiko Paeth Climatologie
    Dr. Katrin Ziegler Climatologie
    Dr. Daniel Abel Climatologie
    Dr. Michael Thiel Télédétection
    Dr. Insa Otte Télédétection

  • University of Halle-Wittenberg

    Germany
    Name Discipline
    Prof. Dr. Christopher Conrad Télédétection, Géoécologie
    Lorenz König Géoinformatique
    Dr. Mike Teucher Télédétection, Géoécologie

  • HEREON - GERICS - Climate Service Center Hamburg

    Germany
    Name Discipline
    Dr. Torsten Weber
    Dr. María Máñez Costa
    Tania Guillén Bolaños *
    Simon Muwafu *

  • University Ouagadougou

    University Ouagadougou

    Burkina Faso
    Name Discipline
    Dr. Jean-Bosco Benewindé Zoungrana and team

  • university accra

    United Nations University Accra

    Ghana
    Name Discipline
    Dr. Ferdinand Tornyie and team

  • university Akure

    Federal University of Technology Akure

    Nigeria
    Name Discipline
    Prof. Dr. Vincent Ajayi Météorologie et science du climat
    Dr. Imoleayo Ezekiel Gbode Météorologie et science du climat

  • AGRHYMET

    AGRHYMET

    Niger
    Name Discipline
    Dr. Seydou B. Traore Agroclimatologie
    Dr. Moussa Waongo Agroclimatologie
    Dr. Amadou Coulibaly Agroclimatologie

  • * Former members

Le portail web - DSS


Qu'est-ce qu'un système d'aide à la décision (DSS)?

  • Il s'agit d'un système informatique interactif et flexible
  • Les DSS sont utilisés pour l'identification et la résolution de problèmes complexes
  • Fournit des informations permettant de prendre la meilleure décision possible

Note

L'aide à la décision n'est ni une proposition de décision ni une décision elle-même. Ce portail vise à fournir des informations solides et efficaces de manière exhaustive.
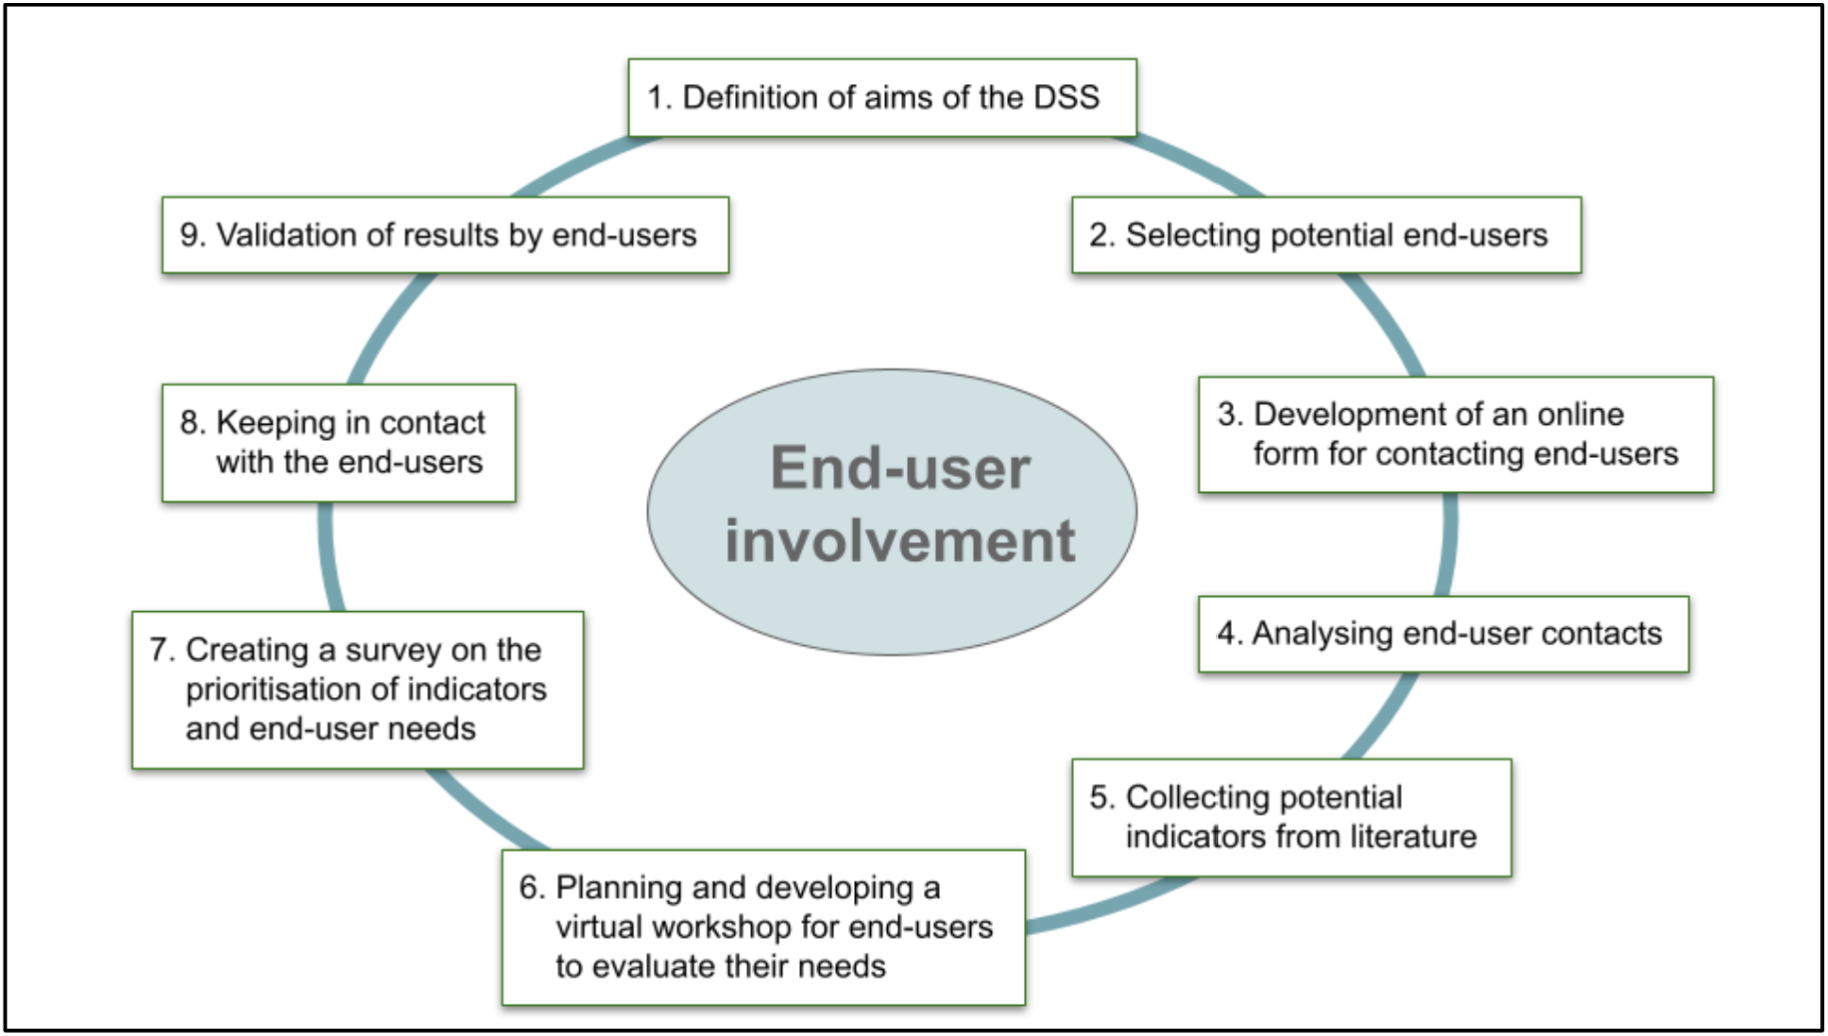


Évaluation du DSS

Une partie importante du processus de co-conception et de co-développement est l'évaluation du DSS par les parties prenantes et les utilisateurs. À cette fin, le projet LANDSURF a organisé un atelier virtuel sur l'évaluation d'une version bêta du système en juin 2023. Lors de cet atelier, jusqu'à 28 participants de différents pays et institutions ont participé à l'atelier virtuel et ont fourni un retour d'information sur la première application du DSS. Pour ce faire, l'accès au système a été donné quelques semaines à l'avance afin de permettre aux parties prenantes de tester le système et sa convivialité. Au cours de l'atelier, le DSS a été présenté au public et des exemples d'application ont été donnés par les développeurs. En outre, les réactions et les contributions supplémentaires des utilisateurs ont été discutées et résumées dans une enquête complémentaire. Les résultats sont rassemblés dans le résumé (english summary, french summary). Les développeurs ont également fait part aux parties prenantes des informations supplémentaires qu'il était prévu d'inclure. Quelques semaines après l'atelier, les parties prenantes et les utilisateurs ont été invités à donner leur avis sur le DSS dans le cadre d'une enquête plus détaillée. Tous les commentaires reçus ont permis de développer le contenu et la convivialité du DSS.


Décisions spatiales - SDSS

Notre système peut être décrit comme un système d'aide à la décision spatiale (SDSS)

  • Les cartes jouent un rôle décisif dans les processus d'aide à la décision
  • L'utilisation de cartes permet de réduire le temps de décision
  • Améliore la compréhensibilité et la précision des résultats
SDSS scheme

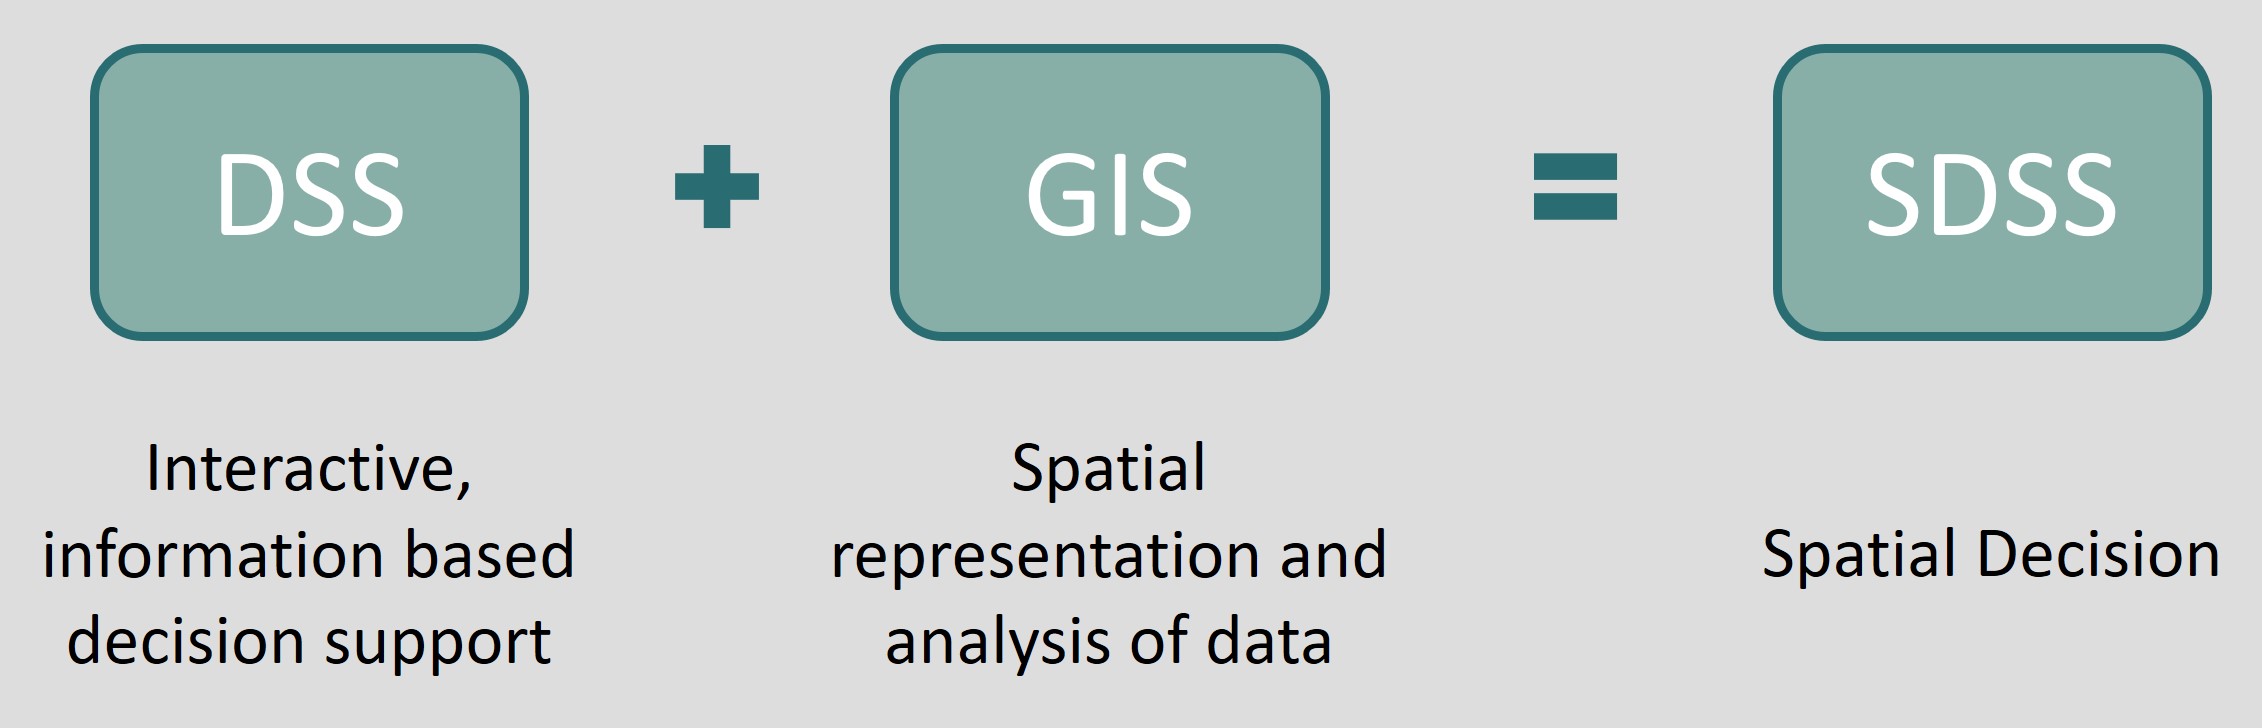
fig. 1: Schéma d'un SDSS

Données de base

Familles de données

Observation (obs)

  • CHIRPS: Données sur les précipitations (estimations par satellite combinées aux mesures des pluviomètres) (Funk et al., 2015)
  • ERA5-Land: Ensemble complet de données climatiques, y compris la température, les précipitations, l'humidité et d'autres variables (réanalyse, données de modèles forcées par des mesures) (Muñoz-Sabater et al., 2021)

Données du modèle

Les modèles climatiques utilisés dans notre projet sont dérivés de CMIP5 (Taylor et al., 2012), un programme coordonné de modèles climatiques globaux, et de CORDEX-CORE (Giorgi et al., 2022), une initiative pour les modèles climatiques régionaux.

Note sur les ensembles modèles: Nous reconnaissons que nos ensembles RCM et GCM sont plutôt petits. Cette limitation découle de la sélection des MCG effectuée pour générer les simulations CORDEX-CORE (Giorgi et al., 2022). Outre les MCG susmentionnés, le modèle HadGEM2-ES (Jones et al., 2011) et les simulations RCM forcées par ce dernier sont également disponibles, mais ont été écartés parce qu'ils n'incluent qu'un calendrier de 360 jours qui n'est pas adapté à certains des indices fournis. Plus de détails sur le traitement et l'utilisation des données du modèle dans LANDSURF peuvent être trouvés dans Abel et al. (2024).

Scénarios

Le DSS fournit des données pour la période 1981-2100. Cette période est divisée en une période historique et une période future qui est simulée sur la base de deux scénarios différents d'émissions de gaz à effet de serre (trajectoire de concentration représentative, RCP) (van Vuuren et al., 2011):

  • hist (1981-2010): Simulation historique servant de référence.
  • rcp26 (2011-2100): Scénario à faibles émissions de gaz à effet de serre.
  • rcp85 (2011-2100): Scénario à fortes émissions de gaz à effet de serre.

Plantes (Indices des cultures seulement)

Cultures disponibles

Les paramètres S et L décrivent la longueur de phase de la culture.

S: Phase courte

L: Phase longue

  • Orge/Avoine/Blé S
  • Orge/Avoine/Blé L
  • Maïs en grains S
  • Maïs en grains L
  • Maïs doux S
  • Maïs doux L
  • Petit mil S
  • Petit mil L
  • Sorgho S
  • Sorgho L
  • Soja S
  • Soja L

Stades de croissance

  • IS: Stade initial
  • CDS: Stade de développement de la culture
  • MSS: Stade intermédiaire de saison
  • LSS: Stade de fin de saison

Le tableau suivant indique la durée des stades et les facteurs de production des cultures sélectionnées (Allen et al., 1998).

Plante Paramètres / Stades Stade initial (IS) Stade de développement de la culture (CDS) Stade intermédiaire de saison (MSS) Stade de fin de saison (LSS)
Orge/Avoine/Blé Facteur de culture (Kc) 0.35 0.75 1.15 0.45
longueur de phase
Longues 15 30 65 40
Courte 15 25 50 30
Maïs en grains Facteur de culture (Kc) 0.4 0.8 1.15 0.7
longueur de phase
Longues 30 50 60 40
Courte 20 35 40 30
Maïs doux Facteur de culture (Kc 0.4 0.8 1.15 1.0
longueur de phase
Longues 20 30 50 10
Courte 20 25 25 10
Petit mil Facteur de culture (Kc 0.35 0.7 1.1 0.65
longueur de phase
Longues 20 30 55 35
Courte 15 25 40 35
Sorgho Facteur de culture (Kc 0.35 0.75 1.1 0.65
longueur de phase
Longues 20 35 45 30
Courte 20 30 40 30
Soja Facteur de culture (Kc 0.35 0.75 1.1 0.6
longueur de phase
Longues 20 30 70 30
Courte 20 30 60 25

Calcul des indices

Indices basés sur des données climatiques

Ces données sont basées soit sur des observations, soit sur des modèles. Les modèles utilisés pour générer les données climatiques sont des modèles physiques complets. Ainsi, les processus dans l'atmosphère, à la surface du sol, etc. sont calculés directement ou paramétrés.

Nous calculons les indices pour chaque année lorsque des données quotidiennes sont disponibles pour toutes les variables nécessaires. L'exigence de variables multiples explique pourquoi certains indices ne peuvent pas être calculés à l'aide de CHIRPS, qui ne fournit que des données sur les précipitations. Cependant, ERA5-Land est disponible en tant que données d'observation pour tous les indices.

Informations générales sur le calcul:

Tous les indices climatologiques et culturaux sont basés sur les précipitations quotidiennes en mm et la température maximale/minimale/moyenne quotidienne à 2 mètres en °C à chaque point de grille.

Remarque : pour les MCG et les observations, lon(i,1)=lon(i,j) pour tout j et lat(1,j)=lat(i,j) pour tout i, ce qui signifie que les coordonnées sont régulières. Ce n'est pas le cas pour les ICR. Les variables lon et lat sont bidimensionnelles parce qu'elles sont converties en un système de coordonnées rotatif pour la modélisation, où la grille est alors équidistante et la sortie du modèle est réorientée vers une grille régulière, mais alors lon et lat ne sont plus équidistantes.

  • Observation: les indices sont calculés pour chaque année de 1981 à 2010
  • Données du modèle: Les indices sont calculés pour chaque année de 1981 à 2100

Calcul de la saison des pluies:

Pour le calcul de la saison des pluies, la méthode de Dunning et al. (2016) avec des modifications suivant Weber et al. (2018) a été utilisée comme décrit dans Abel et al. (2024). Cette méthode est une forme plus spécialisée de Liebmann et al. (2012). Elle est basée sur le calcul des anomalies de précipitations journalières cumulées où le minimum (maximum) se réfère au début (à la fin) de la saison des pluies. De ce fait, il est possible de détecter non seulement la première, mais aussi la deuxième saison des pluies dans certaines régions.

Dans un premier temps, la somme cumulative climatologique de l'anomalie des précipitations quotidiennes est déterminée à chaque maille et ensuite lissée à l'aide d'une moyenne sur 30 jours. Le minimum (maximum) de l'anomalie climatologique cumulée des précipitations quotidiennes est considéré comme le jour de début (de fin) de la saison des pluies climatologique si le jour de début (de fin) est inférieur (supérieur) aux quatre jours précédents et aux quatre jours suivants. Si aucun minimum ou maximum n'est trouvé, la période de lissage est prolongée de 15 jours jusqu'à ce qu'un nombre égal de minima et de maxima soit détecté. Dans le cas contraire, une moyenne glissante de 120 jours est obtenue. Ainsi, nous supposons que le premier maximum après un minimum précédent définit une saison des pluies (Weber et al. 2018). Dans le cas où plus de deux saisons des pluies sont détectées, nous ne prenons en compte que les deux saisons des pluies les plus longues. En outre, si le nombre de jours entre deux saisons des pluies est inférieur à 40 ou si deux saisons des pluies se chevauchent, une seule saison des pluies est supposée.

Dans un deuxième temps, le début et la fin de la saison des pluies sont déterminés pour chaque année. Pour ce faire, on calcule l'anomalie cumulée des précipitations (précipitations quotidiennes moins les précipitations moyennes quotidiennes climatologiques sur la période) et on recherche le minimum/maximum absolu 20 jours avant la date de début climatologique jusqu'à 20 jours après la date de fin climatologique pour chaque année.

Post-traitement

  1. Interpolation spatiale de chaque membre de l'ensemble sur une grille commune.
  2. Construction de la moyenne, du minimum, du maximum et de l'écart-type de l'ensemble pour chaque pixel et chaque année.
  3. Construction de la moyenne mobile (± 15 ans) pour les moyennes d'ensemble afin d'éliminer la variation du modèle et de construire des climatologies (≥ 30 ans) pour une meilleure comparaison.

Valeurs disponibles

Valeurs absolues

= valeur annuelle après post-traitement

La valeur absolue représente la valeur annuelle de chaque indice à chaque pixel de chaque famille de données. Elle est calculée après les étapes de post-traitement.


Moyenne historique de la valeur absolue

= valeur absolue moyenne de 1981 à 2010

La moyenne historique des valeurs absolues est calculée comme la moyenne des valeurs de la période 1981-2010 pour chaque indice et famille de données.


Différence par rapport à la valeur historique

= (valeurs absolues annuelles) - (moyenne historique des valeurs absolues)

La différence est calculée en soustrayant la moyenne historique des valeurs absolues des valeurs absolues annuelles pour chaque indice et famille de données.


Valeur absolue “corrigée du biais” pour les données du modèle

= (différence par rapport à la valeur historique) + (moyenne historique de ERA5-Land)

= (valeur annuelle des données du modèle - moyenne historique de la valeur absolue des données du modèle) + (moyenne historique d'ERA5-Land)*
*à l'exception de spi et spei, qui sont ajustés mensuellement car leur production est également mensuelle. Ensuite, la moyenne des valeurs mensuelles est calculée pour créer des valeurs annuelles.

Toutes les données du modèle ont été corrigées en ajoutant la différence entre les données du scénario futur et les données moyennes historiques du modèle à la moyenne historique des données de référence ERA5-Land. Il s'agit de la méthode dite du delta. Elle suppose que le biais du modèle à chaque pixel (cellule de la grille) reste constant dans le temps et est éliminé par la soustraction (Maraun and Widmann, 2018).

Plutôt que d'afficher les résultats directs des modèles, nous présentons des valeurs ajustées pour tenir compte des erreurs systématiques connues (biais) dans les MCG et les MCR. Notre approche consiste à calculer le changement projeté dans chaque modèle par rapport à ses valeurs historiques. Ce changement est ajouté aux données d'observation historiques. Ainsi, les biais du modèle sont éliminés et le changement modélisé dans le temps est mis en évidence, ce qui est un point fort des modèles climatiques car ils peuvent très bien représenter la tendance générale. Nous utilisons les données ERA5-Land comme référence pour représenter les valeurs absolues, les changements modélisés étant ajoutés pour refléter les projections futures absolues au lieu de montrer les différences.


Tendance

(uniquement pour les données modèles)

= b * 10

b = coefficient de régression en y = bx + a

généré à partir des valeurs annuelles de 2001 à 2100 pour chaque pixel et chaque indice.

La tendance est calculée à partir de l'équation de tendance linéaire des données du modèle original de 2001 à 2100, le temps étant la variable indépendante et la valeur de l'indice correspondante la variable dépendante. Pour évaluer la signification de la tendance, la pente b est testée à l'aide d'un test d'hypothèse bilatéral avec un niveau de signification de 95 % (Wilks, 2020).

Note

Seules les valeurs significatives de b sont représentées, la tendance de tous les autres pixels étant fixée à zéro.


Rapport signal-bruit

(uniquement pour les données modèles)

Signal = tendance
Bruit = écart-type des modèles

= tendance / écart-type de l'ensemble

La force de la tendance est quantifiée en la divisant par l'écart-type de l'ensemble des modèles pour obtenir un rapport tendance-bruit. Cela permet également de comparer la tendance de différents indices, car l'ampleur des unités est éliminée.

La classification du TNR est basée sur Rapp (2000) et Land and Büter (2023).

Le TNR indique le degré de confiance que nous avons dans l'évolution d'une tendance. Une classe TNR plus extrême signifie une probabilité de changement plus élevée, car tous les modèles contribuant à l'analyse s'accordent sur la direction de la tendance.

Pour plus d'informations sur le TNR, voir Hennemuth et al. (2013).

TNR Valeur Interprétation Symbole
TNR ≥2 forte tendance positive
1 ≤ TNR < 2 tendance positive
-1 < TNR < 1 pas de tendance
-2 < TNR ≤ -1 tendance négative
TNR ≤ -2 forte tendance négative

Indices basés sur des données de télédétection

Ces indices sont basés sur des modèles statistiques qui extrapolent les données observées à haute résolution à des périodes pour lesquelles seules des données plus grossières étaient disponibles, sur la base de la relation statistique entre les données au cours de leur chevauchement temporel.

Le traitement des indices de télédétection NDVI et LAI est basée sur des modèles prédictifs pour l'estimation itérative des nouveaux ensembles de données de paramètres de surface terrestre pour l'Afrique de l'Ouest en utilisant des données satellitaires historiques, en se concentrant sur l'amélioration de la résolution spatiale et de la précision. Pour la préparation des données, les ensembles de données MODIS à résolution spatiale plus élevée ont été rééchantillonnés à une taille de pixel de 1 km en utilisant le plus proche voisin pour le traitement initial. Ensuite, 12 composites mensuels ont été créés pour chaque ensemble de données (2003-2022) en utilisant des valeurs moyennes pour capturer les variations saisonnières. Les modèles d'apprentissage automatique XGBoost et Random Forest ont été utilisés car il s'agit de méthodes bien établies, connues pour leur efficacité dans l'analyse des données spatio-temporelles. À partir de ces 12 composites mensuels, des ensembles de données de formation et de test ont été générés pour former les modèles en utilisant les valeurs des données MODIS et le mois correspondant comme caractéristiques. Les modèles testés ont été évalués à l'aide de mesures de précision telles que MAE, RMSE et R2. Dans ce qui suit, seul XGBoost a été utilisé, car il est plus efficace que Random Forest. Sur la base des modèles XGBoost, des ensembles de données de type MODIS à une résolution spatiale de 1 km ont été prédits à partir des données historiques AVHRR afin de générer des prédictions matricielles mensuelles pour la période 1981-2022. Toutes les analyses ont été effectuées à l'aide du langage de programmation Python.

Indices disponibles

Indices basés sur des données climatiques

Sélection des indices

Les indicateurs climatiques présentés dans le système d'aide à la décision (DSS) ont été soigneusement sélectionnés en concertation avec les différentes parties prenantes afin de refléter leurs intérêts et leurs besoins. Bien que nous ne disposions pas d'informations pour toutes les questions possibles, nous avons organisé des ateliers et une enquête avec les parties prenantes et les utilisateurs potentiels au cours du processus de sélection afin d'identifier les indicateurs les plus utiles pour la prise de décision. L'ensemble du processus de sélection des indicateurs climatiques, ainsi que le co-développement et la co-conception du DSS, ont été enregistrés et résumés dans un protocole d'interaction (Fig. 2) (Weber et al., 2023).

SDSS scheme

Fig. 2: Processus de mise en œuvre pour l'implication des utilisateurs et la sélection des indicateurs climatiques

Les indices énumérés dans le DSS ont reçu un score d'au moins 50 % de la part des utilisateurs lors de l'enquête et ont été calculés à partir des données d'observation, de réanalyse et de modèle climatique avec la résolution temporelle et spatiale requise. Une évaluation de certains indicateurs climatiques calculés à partir de données de modèles climatiques a été entreprise et peut être consultée dans Abel et al. (2024).

Indices climatiques

Abréviation Nom Explication Catégorie Unité
dd Nombre de jours secs Nombre annuel de jours secs avec des précipitations journalières < 1 mm Sécheresse [jours]
ddrs Nombre de jours secs pendant la saison des pluies Nombre annuel de jours avec des précipitations < 1 mm pendant la saison des pluies Sécheresse, saison des pluies [jours]
cddrs Jours secs consécutifs pendant la saison des pluies Nombre maximal de jours consécutifs avec des précipitations < 1 mm pendant la saison des pluies Sécheresse, saison des pluies [jours]
cwdi Indice de durée de la vague de froid Nombre de jours dans un intervalle d'au moins 6 jours avec une température minimale < -5°C moyenne (moyenne calculée sur une base journalière d'une période de référence en utilisant une moyenne mobile de 5 jours) Température extrême [jours]
etr Plage de températures extrêmes Différence entre la température max. et min. Température extrême [K]
hwdi Indice de durée de la vague de chaleur Nombre de jours dans un intervalle d'au moins 6 jours avec une température maximale > 5°C moyenne (moyenne calculée sur une base journalière d'une période de référence en utilisant une moyenne mobile de 5 jours) Température extrême [jours]
hwfi Journées chaudes Nombre de jours dans un intervalle d'au moins 6 jours avec une température > 90e percentile (moyenne calculée sur une base journalière d'une période de référence en utilisant une moyenne mobile de 5 jours) Température extrême [jours]
tn10p Nuits extrêmement froides Pourcentage de jours où la température minimale est inférieure au 10e percentile d'une période calculée Température extrême [%]
tx35 Journées chaudes Pourcentage de jours avec une température maximale > 35°C Température extrême [jours]
tn90p Nuits chaudes Pourcentage de jours où la température minimale est supérieure au 90e percentile d'une période calculée Température extrême [%]
tx90p Journées extrêmement chaudes Nombre de jours où la température maximale est supérieure au 90e percentile d'une période calculée Température extrême [%]
rx1day Pluies annuelles maximales sur un jour Précipitations maximales au cours d'une journée Pluies [mm]
r99p Intensité extrême des précipitations quotidiennes 99ème percentile des précipitations journalières Pluies [mm]
r99prs Intensité extrême des précipitations quotidiennes pendant la saison des pluies 99ème percentile des précipitations journalières pendant la saison des pluies Pluies, saison des pluies [mm]
rtot Quantité totale de précipitations des jours humides Quantité totale annuelle de précipitations les jours où les précipitations sont ≥ 1 mm Pluies [mm]
rtotrs Quantité totale de précipitations des jours humides de la saison des pluies Quantité totale annuelle de précipitations les jours où les précipitations sont ≥ 1 mm pendant la saison des pluies Pluies, saison des pluies [mm]
rd Nombre de jours de pluie Nombre annuel de jours avec des précipitations ≥ 1 mm Pluies [jours]
rdrs Nombre de jours de pluie pendant la saison des pluies Nombre annuel de jours avec des précipitations ≥ 1 mm pendant la saison des pluies Pluies, saison des pluies [jours]
cwdrs Jours de pluie consécutifs pendant la saison des pluies Nombre maximal de jours consécutifs avec des précipitations ≥ 1 mm pendant la saison des pluies Pluies, saison des pluies [jours]
rs1 Première saison des pluies Jour du début et de la fin de la première saison des pluies saison des pluies [jour de l'année]
rs2 Deuxième saison des pluies Jour du début et de la fin de la deuxième saison des pluies saison des pluies [jour de l'année]

Indices de sécheresse

Abréviation Nom Explication Catégorie Unité
spi Indice de précipitations normalisé Indice permettant de caractériser la sécheresse à différentes échelles de temps Sécheresse [Index]
spei Indice standardisé d'évapotranspiration des précipitations Extension de l'indice standardisé des précipitations incluant l'évapotranspiration potentielle, représentant ainsi également le signal de température Sécheresse [Index]

L'indice SPI et l'indice SPEI peuvent être classés en différentes classes qui représentent des périodes plus ou moins sévèrement sèches ou humides. La classification utilisée est basée sur les articles suivants de DWD, GERICS, et Liu et al. (2024)

Plage de valeurs Interprétation
SPI/SPEI ≥ 2.0 Extrêmement humide
1.5 ≤ SPI/SPEI < 2.0 Fortement humide
1.0 ≤ SPI/SPEI < 1.5 Moyennement humide
0 < SPI/SPEI < 1.0 Normal (légèrement humide)
-1.0 ≤ SPI/SPEI < 0.0 Normal (légère sécheresse)
-1.5 ≤ SPI/SPEI < -1.0 Sécheresse modérée
-2.0 ≤ SPI/SPEI < -1.5 Sécheresse sévère
SPI/SPEI ≤ -2.0 Sécheresse extrême

Indices des cultures

Abréviation Nom Explication Unité
ir Besoins en eau d'irrigation Bilan hydrique journalier de la zone racinaire [mm]
wa Disponibilité de l'eau Eau disponible pour la croissance des cultures [mm]
cwn Besoins en eau des cultures Eau consommée pendant la période de végétation [mm]

Indices basés sur la télédétection


Abréviation Nom Explication
NDVI Indice de végétation de différence normalisée Indice de verdure de la végétation et donc étroitement lié à la densité et à la productivité de la végétation (Tucker & Sellers, 1986). Le NDVI est calculé à partir des mesures de réflectance spectrale de la longueur d'onde rouge et infrarouge (NIR) et peut varier de -1 à +1.
LAI Indice de surface foliaire L'indice de surface foliaire (LAI) est une variable sans dimension, quantifiant la surface totale unilatérale de feuilles vertes (en m²) par surface (en m²). L'indice de surface foliaire correspond au total de la canopée, y compris les couches du sous-étage (Sellers, 1985) et est une variable climatique essentielle (ECV) définie par le système mondial d'observation du climat (GTOS, 2009).


Plage de valeurs NDVI

Plage de valeurs Interprétation
≤ 0 Eau, surfaces non végétalisées
0 < 0.3 Absence quasi-totale de végétation
0.3 < 0.6 Végétation clairsemée
0.6 < 0.9 Végétation saine
≥ 0.9 Végétation très dense et saine


Plage de valeurs LAI

Plage de valeurs Interprétation
≤ 1 Surfaces non végétalisées
1 < 3 Végétation clairsemée
3 < 6 Arbustes, forêts
7 < 10 Forêts tropicales denses

Citez nos données

Le DSS

Le DSS:
König, L., Ziegler, K., Abel, D., Weber, T., Teucher, M., Otte, I., Ajayi, V., Gbode, I. E., Zoungrana, B. J., Coulibaly, A., Schuck-Zöller, S., Máñez Costa, M., Thiel, M., Paeth, H., Conrad, C. (2024). LANDSURF DSS. https://doi.org/10.5281/zenodo.13318593

Données téléchargées:
https://doi.org/10.58160/gGzexcbDikobkyvK

Contexte scientifique

Données brutes avant traitement pour le DSS:

Ziegler, K., Abel, D., & Paeth, H. (2024). https://doi.org/10.58160/99

Publications évaluées par des pairs:

Abel, D., Ziegler, K., Gbode, I. E., Weber, T., Ajayi, V. O., Traoré, S. B., & Paeth, H. (2024). Robustness of climate indices relevant for agriculture in Africa deduced from GCMs and RCMs against reanalysis and gridded observations. Climate Dynamics, 62, 1077-1106. https://doi.org/10.1007/s00382-023-06956-8

Ziegler, K., Abel, D., Weber, T., & Paeth, H. (). Development of climate indices relevant for agriculture in Africa under different climate change scenarios based on GCM and RCM ensembles. Under review for Environmental Research: Climate

Références

Abel, D., Ziegler, K., Gbode, I. E., Weber, T., Ajayi, V. O., Traoré, S. B., & Paeth, H. (2024). Robustness of climate indices relevant for agriculture in Africa deduced from GCMs and RCMs against reanalysis and gridded observations. Climate Dynamics, 62, 1077–1106. https://doi.org/10.1007/s00382-023-06956-8

Allen, R., Pereira, L., & Smith, M. (1998). Crop evapotranspiration: Guidelines for computing crop water requirements. FAO irrigation and drainage paper: Vol. 56. Rome: Food and Agriculture Organization of the United States. Retrieved from https://www.fao.org/3/X0490E/x0490e00.htm

Bentsen, M., Bethke, I., Debernard, J. B., Iversen, T., Kirkevåg, A., Seland, Ø., Drange, H., Roelandt, C., Seierstad, I. A., Hoose, C., & Kristjánsson, J. E. (2013). The Norwegian Earth System Model, NorESM1-M – Part 1: Description and basic evaluation of the physical climate. Geoscientific Model Development, 6, 687–720. https://doi.org/10.5194/gmd-6-687-2013

Dunning, C. M., Black, E. C. L., & Allan, R. P. (2016). The onset and cessation of seasonal rainfall over Africa. Journal of Geophysical Research Atmospheres, 121(19), 11405–11424. https://doi.org/10.1002/2016JD025428

Funk, C., Peterson, P., Landsfeld, M., Pedreros, D., Verdin, J., Shukla, S., Husak, G., Rowland, J., Harrison, L., Hoell, A., & Michaelsen, J. (2015). The climate hazards infrared precipitation with stations - a new environmental record for monitoring extremes. Scientific Data, 2, 150066. https://doi.org/10.1038/sdata.2015.66

Giorgetta, M. A., Roeckner, E., Mauritsen, T., Bader, J., Crueger, T., Esch, M., Rast, S., Kornblueh, L., Schmidt, H., Kinne, S., Hohenegger, C., Möbis, B., Krismer, T., Wieners, K.‑H., & Stevens, B. (2013). The atmospheric general circulation model ECHAM6: Model description (Reports on Earth System Science 0937-1060). https://doi.org/10.1029/2010JD014036

Giorgi, F., Coppola, E., Jacob, D., Teichmann, C., Omar, S. A., Ashfaq, M., Ban, N., Bülow, K., Bukovsky, M., Buntemeyer, L., Cavazos, T., Ciarlo, J., Da Rocha, R. P., Das, S., Di Sante, F., Evans, J. P., Gao, X., Giuliani, G., Glazer, R. H., . . . Weber, T. (2022). The CORDEX-CORE EXP-I initiative: Description and highlight results from the initial analysis. Bulletin of the American Meteorological Society, 103(2), E293-E310. https://doi.org/10.1175/BAMS-D-21-0119.1

Giorgi, F., Coppola, E., Solmon, F., Mariotti, L., Sylla, M. B., Bi, X., Elguindi, N., Diro, G. T., Nair, V., Giuliani, G., Turuncoglu, U. U., Cozzini, S., Güttler, I., O'Brien, T. A., Tawfik, A. B., Shalaby, A., Zakey, A. S., Steiner, A. L., Stordal, F., . . . Brankovic, C. (2012). RegCM4: Model description and preliminary tests over multiple CORDEX domains. Climate Research, 52, 7–29. https://doi.org/10.3354/cr01018

GLOBAL TERRESTRIAL OBSERVING SYSTEM (GTOS) (2009). LAI. Assessment of the status of the development of the standards for the terrestrial essential climate variables. GTOS 66. http://www.fao.org/gtos/doc/ECVs/T11/T11.pdf

Hennemuth, B., Bender, S., Bülow, K., Dreier, N., Keup-Thiel, E., Krüger, O., Mudersbach, C., Radermacher, C., & Schoetter, R. (2013). Statistical methods for the analysis of simulated and observed climate data, applied in projects and institutions dealing with climate change impact and adaptation. CSC Report 13, Climate Service Center, Germany. Retrieved from https://www.climate-service-center.de/imperia/md/content/csc/projekte/csc-report13_engl.pdf

Jacob, D., Elizalde, A., Haensler, A., Hagemann, S., Kumar, P., Podzun, R., Rechid, D., Remedio, A. R. C., Saeed, F., Sieck, K., Teichmann, C., & Wilhelm, C. (2012). Assessing the transferability of the regional climate model REMO to different coordinated regional climate downscaling experiment (CORDEX) regions. Atmosphere, 3(1), 181–199. https://doi.org/10.3390/atmos3010181

Jacob, D., & Podzun, R. (1997). Sensitivity studies with the regional climate model REMO. Meteorology and Atmospheric Physics, 63(1-2), 119–129. https://doi.org/10.1007/BF01025368

Jones, C. D., Hughes, J. K., Bellouin, N., Hardiman, S. C., Jones, G. S., Knight, J., Liddicoat, S., O'Connor, F. M., Andres, R. J., Bell, C., Boo, K. O., Bozzo, A., Butchart, N., Cadule, P., Corbin, K. D., Doutriaux-Boucher, M., Friedlingstein, P., Gornall, J., Gray, L., . . . Zerroukat, M. (2011). The HadGEM2-ES implementation of CMIP5 centennial simulations. Geoscientific Model Development, 4(3), 543–570. https://doi.org/10.5194/gmd-4-543-2011

Land, C. & Büter, B. (last updated 2023). Grundlagen und Empfehlungen für eine Klimaanpassungsstrategie der Region Hannover. Retrieved from https://www.hannover.de/Leben-in-der-Region-Hannover/Umwelt-Nachhaltigkeit/Klimawandel-und-anpassung/Die-Region-Hannover-im-Klimawandel/Gutachten-zur-Klimaanpassung

Liebmann, B., Bladé, I., Kiladis, G. N., Carvalho, L. M. V., Senay, G. B., Allured, D., Leroux, S., & Funk, C. (2012). Seasonality of African Precipitation from 1996 to 2009. Journal of Climate, 25(12), 4304–4322. https://doi.org/10.1175/JCLI-D-11-00157.1

Liu, X., Yu, S., Yang, Z., Dong, J., & Peng, J. (2024). The first global multi-timescale daily SPEI dataset from 1982 to 2021. Scientific Data, 11, 223. https://doi.org/10.1038/s41597-024-03047-z

Maraun, D. & Widmann, M. (2018). Statistical downscaling and bias correction for climate research, Cambridge University Press, Cambridge, UK, 2018. https://doi.org/10.1017/9781107588783

Muñoz-Sabater, J., Dutra, E., Agustí-Panareda, A., Albergel, C., Arduini, G., Balsamo, G., Boussetta, S., Choulga, M., Harrigan, S., Hersbach, H., Martens, B., Miralles, D. G., Piles, M., Rodríguez-Fernández, N. J., Zsoter, E., Buontempo, C., & Thépaut, J.‑N. (2021). ERA5-Land: a state-of-the-art global reanalysis dataset for land applications. Earth System Science Data, 13, 4349–4383. https://doi.org/10.5194/essd-13-4349-2021

Rapp, J. (2000). Problematik und Ergebnisse klimatologischer Trendanalysen für Europa und Deutschland. Offenbach (Berichte des Deutschen Wetterdienstes: 212). ISBN 978-3-88148-365-0. Retrieved from https://www.dwd.de/DE/leistungen/pbfb_verlag_berichte/pdf_einzelbaende/212_pdf.pdf;jsessionid=B3D5AA2D7045470C42333B7DAAD67221.live31082?__blob=publicationFile&v=5

Remedio, A. R. C., Teichmann, C., Buntemeyer, L., Sieck, K., Weber, T., Rechid, D., Hoffmann, P., Nam, C., Kotova, L., & Jacob, D. (2019). Evaluation of New CORDEX Simulations Using an Updated Köppen–Trewartha Climate Classification. Atmosphere, 10(11), 726. https://doi.org/10.3390/atmos10110726

Sellers, P. J. (1985). Canopy reflectance, photosynthesis and transpiration. Int J Remote Sens, 6, 1335–1372.

Sørland, S. L., Brogli, R., Pothapakula, P. K., Russo, E., van de Walle, J., Ahrens, B., Anders, I., Bucchignani, E., Davin, E. L., Demory, M.‑E., Dosio, A., Feldmann, H., Früh, B., Geyer, B., Keuler, K., Lee, D., Li, D., van Lipzig, N. P., Min, S.‑K., . . . Thiery, W. (2021). COSMO-CLM Regional Climate Simulations in the CORDEX framework: a review. Geoscientific Model Development, 14, 5125–5154. https://doi.org/10.5194/gmd-2020-443

Taylor, K. E., Stouffer, R. J., & Meehl, G. A. (2012). An overview of CMIP5 and the experiment design. Bulletin of the American Meteorological Society, 93(4), 485–498. https://doi.org/10.1175/BAMS-D-11-00094.1

Tucker, C. J. & Sellers, P. J. (1986). Satellite remote sensing of primary production. Int. J. Remote Sens., 7, 1395–1416.

van Vuuren, D. P., Edmonds, J., Kainuma, M., Riahi, K., Thomson, A., Hibbard, K., Hurtt, G. C., Kram, T., Krey, V., Lamarque, J. F. , Masui, T., Meinshausen, M, Nakicenovic, N., Smith, S. J., & Rose, S. K. (2011). The representative concentration pathways: An overview. Climatic Change, 109, 5. https://doi.org/10.1007/s10584-011-0148-z

Weber, T., Gbode, I. E., Ziegler, K., Abel, D., Ajayi, V. O., Otte, I., Zoungrana, B. J.-B., Coulibaly, A., Máñez Costa, M., Guillén Bolaños, T., Muwafu, S. & Paeth, H. (2023). Users’ interaction protocol to identify specific climate indicators and end-user needs for the development of a decision support system (DSS). WASCAL WRAP2.0: LANDSURF project. Retrieved from https://www.climate-service-center.de/imperia/md/content/csc/gerics/wascal_landsurf_end-user_interaction_protocol.pdf

Weber, T., Haensler, A., Rechid, D., Pfeifer, S., Eggert, B., & Jacob, D (2018). Analyzing Regional Climate Change in Africa in a 1.5, 2, and 3°C Global Warming World. Earth's Future, 6(4), 643–655. https://doi.org/10.1002/2017EF000714

Wilks, D. S., (2020). Statistical Methods in the Atmospheric Sciences. 4th ed. Elsevier, 840 pp. https://doi.org/10.1016/C2017-0-03921-6

Imprint - Legal Information

Imprint

Information pursuant to Sect. 5 German Telemedia Act (TMG)

Publisher

Martin-Luther-University Halle-Wittenberg
Institute of Geosciences and Geography
Department Geoecology
Von-Seckendorff-Platz 4, 06120 Halle (Saale)


Contact

lorenz.koenig@geo.uni-halle.de


Copyright

All rights reserved, Martin Luther University Halle-Wittenberg, Institute of Geosciences, Department of Geoecology, 06120 Halle (Saale).

The online documents and web pages of the Website including their parts are protected by copyright. They may only be copied and printed for private, scientific and non-commercial use for information purposes if they contain the copyright notice.

Martin Luther University Halle-Wittenberg reserves the right to revoke this permission at any time. Without the prior written permission of the Martin Luther University Halle-Wittenberg, these documents/web pages may not be reproduced, archived, stored on another server, included in newsgroups, used in online services or stored on other data carriers. They may, however, be copied into a cache or proxy server to optimise access speed. We expressly permit and welcome the citation of our documents and web pages as well as the setting of links to the web content.

Licenses

The LANDSURF Website uses various Open Source Software Packages. Following is a table of the packages used and their corresponding license.

Package License Copyright
Bootstrap MIT License Copyright (c) 2011-2023 Twitter, Inc., Copyright (c) 2011-2023 The Bootstrap Authors
jQuery MIT License Copyright (c) 2023 OpenJS Foundation
Openlayers BSD 2-Clause License Copyright 2005-present, OpenLayers Contributors All rights reserved.
ol-layerswitcher MIT License Copyright (c) 2023 Matt Walker
Datatables MIT License Copyright (C) 2008-2023, SpryMedia Ltd.
jQuery Datatables MIT License Copyright (c) 2016 Mohd Khairi
Chart.js MIT License Copyright (c) 2014-2023 Chart.js Contributors
Tippy.js License Copyright (c) 2017-present atomiks
Boarding.js MIT License Copyright (c) Josias Ribi
print.js MIT License Copyright (c) Rodrigo Vieira
jsZip MIT License Copyright (c) Stuart Knightley
jsPDF MIT License Copyright (c) James Hall, yWorks GmbH
Fontawesome Fonts SIL OFL 1.1 License Copyright (c) 2023 Fonticons, Inc.
Fontawesome Icons CC BY 4.0 License Copyright (c) 2023 Fonticons, Inc.
Fontawesome Code MIT License Copyright (c) 2023 Fonticons, Inc.
Geoserver GNU General Public License Version 2.0 Copyright (C) 2014-2023 Open Source Geospatial Foundation
Tomcat Apache License, Version 2.0 Copyright © 2023 The Apache Software Foundation
Apache Apache License, Version 2.0 Copyright © 2023 The Apache Software Foundation
Documentation Bootstrap Template GNU General Public License Copyright © 2024 Xiaoying Riley
NoUiSlider MIT License Copyright © 2019 Léon Gersen
Luxon MIT License Copyright © 2019 JS Foundation and other contributors

Disclaimer

Content

The author accepts no responsibility for the topicality, correctness, completeness or quality of the information provided. Liability claims against the author relating to material or non-material damage caused by the use or non-use of the information provided or by the use of incorrect or incomplete information are excluded as a matter of principle, insofar as there is no demonstrable intentional or grossly negligent fault on the part of the author. All offers are subject to change and non-binding. The author expressly reserves the right to change, supplement or delete parts of the pages or the entire offer without separate announcement or to discontinue publication temporarily or permanently.

References / Links

The author is not responsible for any contents linked or referred to from his pages - unless he has full knowledge of illegal contents and would be able to prevent the visitors of his site fromviewing those pages. The author hereby expressly declares that at the time the links were created, no illegal content was discernible on the linked pages. The author has no influence on the current and future design, content or authorship of the linked pages. For this reason, he hereby expressly distances himself from all content of all linked pages that were changed after the link was created. This statement applies to all links and references set within the author's own website as well as to external entries in guest books, discussion forums and mailing lists set up by the author. Liability for illegal, incorrect or incomplete content and in particular for damages arising from the use or non-use of such information lies solely with the provider of the page to which reference is made, and not with the party who merely refers to the respective publication via links.

Copyright & Trademark Law

The author endeavours to observe the copyrights of the graphics and texts used in all publications, to use graphics and texts created by himself or to resort to licence-free graphics and texts. All brand names and trademarks mentioned on the website and possibly protected by third parties are subject without restriction to the provisions of the applicable trademark law and the ownership rights of the respective registered owners. The mere mention of a trademark does not imply that it is not protected by the rights of third parties!

Privacy Policy

We are very delighted that you have shown interest in our enterprise. Data protection is of a particularly high priority for the management of the Martin Luther University Halle-Wittenberg. The use of the Internet pages of the Martin Luther University Halle-Wittenberg is possible without any indication of personal data; however, if a data subject wants to use special enterprise services via our website, processing of personal data could become necessary. If the processing of personal data is necessary and there is no statutory basis for such processing, we generally obtain consent from the data subject.

The processing of personal data, such as the name, address, e-mail address, or telephone number of a data subject shall always be in line with the General Data Protection Regulation (GDPR), and in accordance with the country-specific data protection regulations applicable to the Martin Luther University Halle-Wittenberg. By means of this data protection declaration, our enterprise would like to inform the general public of the nature, scope, and purpose of the personal data we collect, use and process. Furthermore, data subjects are informed, by means of this data protection declaration, of the rights to which they are entitled.

As the controller, the Martin Luther University Halle-Wittenberg has implemented numerous technical and organizational measures to ensure the most complete protection of personal data processed through this website. However, Internet-based data transmissions may in principle have security gaps, so absolute protection may not be guaranteed. For this reason, every data subject is free to transfer personal data to us via alternative means, e.g. by telephone.

1. Definitions

The data protection declaration of the Martin Luther University Halle-Wittenberg is based on the terms used by the European legislator for the adoption of the General Data Protection Regulation (GDPR). Our data protection declaration should be legible and understandable for the general public, as well as our customers and business partners. To ensure this, we would like to first explain the terminology used.

In this data protection declaration, we use, inter alia, the following terms:

  • a)    Personal data

    Personal data means any information relating to an identified or identifiable natural person (“data subject”). An identifiable natural person is one who can be identified, directly or indirectly, in particular by reference to an identifier such as a name, an identification number, location data, an online identifier or to one or more factors specific to the physical, physiological, genetic, mental, economic, cultural or social identity of that natural person.

  • b) Data subject

    Data subject is any identified or identifiable natural person, whose personal data is processed by the controller responsible for the processing.

  • c)    Processing

    Processing is any operation or set of operations which is performed on personal data or on sets of personal data, whether or not by automated means, such as collection, recording, organisation, structuring, storage, adaptation or alteration, retrieval, consultation, use, disclosure by transmission, dissemination or otherwise making available, alignment or combination, restriction, erasure or destruction.

  • d)    Restriction of processing

    Restriction of processing is the marking of stored personal data with the aim of limiting their processing in the future.

  • e)    Profiling

    Profiling means any form of automated processing of personal data consisting of the use of personal data to evaluate certain personal aspects relating to a natural person, in particular to analyse or predict aspects concerning that natural person's performance at work, economic situation, health, personal preferences, interests, reliability, behaviour, location or movements.

  • f)     Pseudonymisation

    Pseudonymisation is the processing of personal data in such a manner that the personal data can no longer be attributed to a specific data subject without the use of additional information, provided that such additional information is kept separately and is subject to technical and organisational measures to ensure that the personal data are not attributed to an identified or identifiable natural person.

  • g)    Controller or controller responsible for the processing

    Controller or controller responsible for the processing is the natural or legal person, public authority, agency or other body which, alone or jointly with others, determines the purposes and means of the processing of personal data; where the purposes and means of such processing are determined by Union or Member State law, the controller or the specific criteria for its nomination may be provided for by Union or Member State law.

  • h)    Processor

    Processor is a natural or legal person, public authority, agency or other body which processes personal data on behalf of the controller.

  • i)      Recipient

    Recipient is a natural or legal person, public authority, agency or another body, to which the personal data are disclosed, whether a third party or not. However, public authorities which may receive personal data in the framework of a particular inquiry in accordance with Union or Member State law shall not be regarded as recipients; the processing of those data by those public authorities shall be in compliance with the applicable data protection rules according to the purposes of the processing.

  • j)      Third party

    Third party is a natural or legal person, public authority, agency or body other than the data subject, controller, processor and persons who, under the direct authority of the controller or processor, are authorised to process personal data.

  • k)    Consent

    Consent of the data subject is any freely given, specific, informed and unambiguous indication of the data subject's wishes by which he or she, by a statement or by a clear affirmative action, signifies agreement to the processing of personal data relating to him or her.

2. Name and Address of the controller

Controller for the purposes of the General Data Protection Regulation (GDPR), other data protection laws applicable in Member states of the European Union and other provisions related to data protection is:

Martin Luther University Halle-Wittenberg

Van-Seckendorff-Platz 4

06120 Halle (Saale)

Germany

Phone: +49/345/5526061

Email: lorenz.koenig@geo.uni-halle.de

Website: landsurf.geo.uni-halle.de

3. Cookies

The Internet pages of the Martin Luther University Halle-Wittenberg use cookies. Cookies are text files that are stored in a computer system via an Internet browser.

Many Internet sites and servers use cookies. Many cookies contain a so-called cookie ID. A cookie ID is a unique identifier of the cookie. It consists of a character string through which Internet pages and servers can be assigned to the specific Internet browser in which the cookie was stored. This allows visited Internet sites and servers to differentiate the individual browser of the dats subject from other Internet browsers that contain other cookies. A specific Internet browser can be recognized and identified using the unique cookie ID.

Through the use of cookies, the Martin Luther University Halle-Wittenberg can provide the users of this website with more user-friendly services that would not be possible without the cookie setting.

By means of a cookie, the information and offers on our website can be optimized with the user in mind. Cookies allow us, as previously mentioned, to recognize our website users. The purpose of this recognition is to make it easier for users to utilize our website. The website user that uses cookies, e.g. does not have to enter access data each time the website is accessed, because this is taken over by the website, and the cookie is thus stored on the user's computer system. Another example is the cookie of a shopping cart in an online shop. The online store remembers the articles that a customer has placed in the virtual shopping cart via a cookie.

The data subject may, at any time, prevent the setting of cookies through our website by means of a corresponding setting of the Internet browser used, and may thus permanently deny the setting of cookies. Furthermore, already set cookies may be deleted at any time via an Internet browser or other software programs. This is possible in all popular Internet browsers. If the data subject deactivates the setting of cookies in the Internet browser used, not all functions of our website may be entirely usable.

4. Collection of general data and information

The website of the Martin Luther University Halle-Wittenberg collects a series of general data and information when a data subject or automated system calls up the website. This general data and information are stored in the server log files. Collected may be (1) the browser types and versions used, (2) the operating system used by the accessing system, (3) the website from which an accessing system reaches our website (so-called referrers), (4) the sub-websites, (5) the date and time of access to the Internet site, (6) an Internet protocol address (IP address), (7) the Internet service provider of the accessing system, and (8) any other similar data and information that may be used in the event of attacks on our information technology systems.

When using these general data and information, the Martin Luther University Halle-Wittenberg does not draw any conclusions about the data subject. Rather, this information is needed to (1) deliver the content of our website correctly, (2) optimize the content of our website as well as its advertisement, (3) ensure the long-term viability of our information technology systems and website technology, and (4) provide law enforcement authorities with the information necessary for criminal prosecution in case of a cyber-attack. Therefore, the Martin Luther University Halle-Wittenberg analyzes anonymously collected data and information statistically, with the aim of increasing the data protection and data security of our enterprise, and to ensure an optimal level of protection for the personal data we process. The anonymous data of the server log files are stored separately from all personal data provided by a data subject.

5. Contact possibility via the website

The website of the Martin Luther University Halle-Wittenberg contains information that enables a quick electronic contact to our enterprise, as well as direct communication with us, which also includes a general address of the so-called electronic mail (e-mail address). If a data subject contacts the controller by e-mail or via a contact form, the personal data transmitted by the data subject are automatically stored. Such personal data transmitted on a voluntary basis by a data subject to the data controller are stored for the purpose of processing or contacting the data subject. There is no transfer of this personal data to third parties.

6. Routine erasure and blocking of personal data

The data controller shall process and store the personal data of the data subject only for the period necessary to achieve the purpose of storage, or as far as this is granted by the European legislator or other legislators in laws or regulations to which the controller is subject to.

If the storage purpose is not applicable, or if a storage period prescribed by the European legislator or another competent legislator expires, the personal data are routinely blocked or erased in accordance with legal requirements.

7. Rights of the data subject

  • a) Right of confirmation

    Each data subject shall have the right granted by the European legislator to obtain from the controller the confirmation as to whether or not personal data concerning him or her are being processed. If a data subject wishes to avail himself of this right of confirmation, he or she may, at any time, contact any employee of the controller.

  • b) Right of access

    Each data subject shall have the right granted by the European legislator to obtain from the controller free information about his or her personal data stored at any time and a copy of this information. Furthermore, the European directives and regulations grant the data subject access to the following information:

    • the purposes of the processing;
    • the categories of personal data concerned;
    • the recipients or categories of recipients to whom the personal data have been or will be disclosed, in particular recipients in third countries or international organisations;
    • where possible, the envisaged period for which the personal data will be stored, or, if not possible, the criteria used to determine that period;
    • the existence of the right to request from the controller rectification or erasure of personal data, or restriction of processing of personal data concerning the data subject, or to object to such processing;
    • the existence of the right to lodge a complaint with a supervisory authority;
    • where the personal data are not collected from the data subject, any available information as to their source;
    • the existence of automated decision-making, including profiling, referred to in Article 22(1) and (4) of the GDPR and, at least in those cases, meaningful information about the logic involved, as well as the significance and envisaged consequences of such processing for the data subject.

    Furthermore, the data subject shall have a right to obtain information as to whether personal data are transferred to a third country or to an international organisation. Where this is the case, the data subject shall have the right to be informed of the appropriate safeguards relating to the transfer.

    If a data subject wishes to avail himself of this right of access, he or she may, at any time, contact any employee of the controller.

  • c) Right to rectification

    Each data subject shall have the right granted by the European legislator to obtain from the controller without undue delay the rectification of inaccurate personal data concerning him or her. Taking into account the purposes of the processing, the data subject shall have the right to have incomplete personal data completed, including by means of providing a supplementary statement.

    If a data subject wishes to exercise this right to rectification, he or she may, at any time, contact any employee of the controller.

  • d) Right to erasure (Right to be forgotten)

    Each data subject shall have the right granted by the European legislator to obtain from the controller the erasure of personal data concerning him or her without undue delay, and the controller shall have the obligation to erase personal data without undue delay where one of the following grounds applies, as long as the processing is not necessary:

    • The personal data are no longer necessary in relation to the purposes for which they were collected or otherwise processed.
    • The data subject withdraws consent to which the processing is based according to point (a) of Article 6(1) of the GDPR, or point (a) of Article 9(2) of the GDPR, and where there is no other legal ground for the processing.
    • The data subject objects to the processing pursuant to Article 21(1) of the GDPR and there are no overriding legitimate grounds for the processing, or the data subject objects to the processing pursuant to Article 21(2) of the GDPR.
    • The personal data have been unlawfully processed.
    • The personal data must be erased for compliance with a legal obligation in Union or Member State law to which the controller is subject.
    • The personal data have been collected in relation to the offer of information society services referred to in Article 8(1) of the GDPR.

    If one of the aforementioned reasons applies, and a data subject wishes to request the erasure of personal data stored by the Martin Luther University Halle-Wittenberg, he or she may, at any time, contact any employee of the controller. An employee of Martin Luther University Halle-Wittenberg shall promptly ensure that the erasure request is complied with immediately.

    Where the controller has made personal data public and is obliged pursuant to Article 17(1) to erase the personal data, the controller, taking account of available technology and the cost of implementation, shall take reasonable steps, including technical measures, to inform other controllers processing the personal data that the data subject has requested erasure by such controllers of any links to, or copy or replication of, those personal data, as far as processing is not required. An employees of the Martin Luther University Halle-Wittenberg will arrange the necessary measures in individual cases.

  • e) Right of restriction of processing

    Each data subject shall have the right granted by the European legislator to obtain from the controller restriction of processing where one of the following applies:

    • The accuracy of the personal data is contested by the data subject, for a period enabling the controller to verify the accuracy of the personal data.
    • The processing is unlawful and the data subject opposes the erasure of the personal data and requests instead the restriction of their use instead.
    • The controller no longer needs the personal data for the purposes of the processing, but they are required by the data subject for the establishment, exercise or defence of legal claims.
    • The data subject has objected to processing pursuant to Article 21(1) of the GDPR pending the verification whether the legitimate grounds of the controller override those of the data subject.

    If one of the aforementioned conditions is met, and a data subject wishes to request the restriction of the processing of personal data stored by the Martin Luther University Halle-Wittenberg, he or she may at any time contact any employee of the controller. The employee of the Martin Luther University Halle-Wittenberg will arrange the restriction of the processing.

  • f) Right to data portability

    Each data subject shall have the right granted by the European legislator, to receive the personal data concerning him or her, which was provided to a controller, in a structured, commonly used and machine-readable format. He or she shall have the right to transmit those data to another controller without hindrance from the controller to which the personal data have been provided, as long as the processing is based on consent pursuant to point (a) of Article 6(1) of the GDPR or point (a) of Article 9(2) of the GDPR, or on a contract pursuant to point (b) of Article 6(1) of the GDPR, and the processing is carried out by automated means, as long as the processing is not necessary for the performance of a task carried out in the public interest or in the exercise of official authority vested in the controller.

    Furthermore, in exercising his or her right to data portability pursuant to Article 20(1) of the GDPR, the data subject shall have the right to have personal data transmitted directly from one controller to another, where technically feasible and when doing so does not adversely affect the rights and freedoms of others.

    In order to assert the right to data portability, the data subject may at any time contact any employee of the Martin Luther University Halle-Wittenberg.

  • g) Right to object

    Each data subject shall have the right granted by the European legislator to object, on grounds relating to his or her particular situation, at any time, to processing of personal data concerning him or her, which is based on point (e) or (f) of Article 6(1) of the GDPR. This also applies to profiling based on these provisions.

    The Martin Luther University Halle-Wittenberg shall no longer process the personal data in the event of the objection, unless we can demonstrate compelling legitimate grounds for the processing which override the interests, rights and freedoms of the data subject, or for the establishment, exercise or defence of legal claims.

    If the Martin Luther University Halle-Wittenberg processes personal data for direct marketing purposes, the data subject shall have the right to object at any time to processing of personal data concerning him or her for such marketing. This applies to profiling to the extent that it is related to such direct marketing. If the data subject objects to the Martin Luther University Halle-Wittenberg to the processing for direct marketing purposes, the Martin Luther University Halle-Wittenberg will no longer process the personal data for these purposes.

    In addition, the data subject has the right, on grounds relating to his or her particular situation, to object to processing of personal data concerning him or her by the Martin Luther University Halle-Wittenberg for scientific or historical research purposes, or for statistical purposes pursuant to Article 89(1) of the GDPR, unless the processing is necessary for the performance of a task carried out for reasons of public interest.

    In order to exercise the right to object, the data subject may contact any employee of the Martin Luther University Halle-Wittenberg. In addition, the data subject is free in the context of the use of information society services, and notwithstanding Directive 2002/58/EC, to use his or her right to object by automated means using technical specifications.

  • h) Automated individual decision-making, including profiling

    Each data subject shall have the right granted by the European legislator not to be subject to a decision based solely on automated processing, including profiling, which produces legal effects concerning him or her, or similarly significantly affects him or her, as long as the decision (1) is not is necessary for entering into, or the performance of, a contract between the data subject and a data controller, or (2) is not authorised by Union or Member State law to which the controller is subject and which also lays down suitable measures to safeguard the data subject's rights and freedoms and legitimate interests, or (3) is not based on the data subject's explicit consent.

    If the decision (1) is necessary for entering into, or the performance of, a contract between the data subject and a data controller, or (2) it is based on the data subject's explicit consent, the Martin Luther University Halle-Wittenberg shall implement suitable measures to safeguard the data subject's rights and freedoms and legitimate interests, at least the right to obtain human intervention on the part of the controller, to express his or her point of view and contest the decision.

    If the data subject wishes to exercise the rights concerning automated individual decision-making, he or she may, at any time, contact any employee of the Martin Luther University Halle-Wittenberg.

  • i) Right to withdraw data protection consent

    Each data subject shall have the right granted by the European legislator to withdraw his or her consent to processing of his or her personal data at any time.

    If the data subject wishes to exercise the right to withdraw the consent, he or she may, at any time, contact any employee of the Martin Luther University Halle-Wittenberg.