About the LANDSURF Project

Goals and Objectives

The African continent faces various challenges and numerous risks due to past and current climate change and variability. To strengthen the resilience of West African societies in the sectors of agriculture, food security, water and risk management, adaptation measures need to be planned and implemented in time. Planning and implementing climate change adaptation measures requires reliable and easily accessible local to community-scale climate information tailored to the needs of different stakeholders.

Against this background, the German Federal Ministry of Education and Research (BMBF) funded a project, Land surface processes as a determinant of climate change in Africa (LANDSURF), to identify and calculate indices relevant to African stakeholders in the agricultural sector. The LANDSURF project is part of the second phase of the West African Science Service Center on Climate Change and Adapted Land-Use (WASCAL) Research Action Plan (WRAP2.0), which aims to generate demand-driven climate and environmental services to support decision making by policy makers and other stakeholders in the agricultural sector. Hence the development of the Decision Support System (DSS) for Agriculture, Water and Risk Management in West Africa. Prior to the development of the DSS, initial stakeholders’ workshops were held, where some relevant agriculture-specific indices were presented, discussed and validated. The resulting list of indicators was used as the target variables of the DSS database. The indicators are related to a wide range of aspects, including temperature, precipitation, the rainy season, drought, and agricultural indices. On this basis, we compared and selected adequate observation and model data to calculate the required indices for the past (1981-2010) as well as for three future periods until the end of the century under the assumption of two different greenhouse gas emission scenarios. As model data, we included models with coarse and fine spatial resolutions to ensure a resolution being on the scale of regional to local decision processes. Thus, the data and indicators in the DSS are able to set a ground for sound and informed decision-making on adaptation measures to face the threats of climate change. To better understand and interpret the results, users of the DSS and its data are strongly advised to read the subsequent documentation.

Main Goals:

  • Make obtained data from the LANDSURF project freely and easily accessible
  • Co-development of design and contents together with stakeholders
  • Transfer, dissemination and distribution of knowledge, climate information and data from research
  • Enable stakeholders and smallholders to incorporate the data and insights gained into their decision-making process
  • Strengthen resilience of West African stakeholders and smallholders in regard to climate change

Project Partners

WASCAL-LANDSURF is being carried out under the leadership of the Institute of Geography and Geology at the University of Würzburg, Germany. Other project partners are the Climate Service Center Germany (GERICS), the Institute of Geosciences and Geography at the University of Halle-Wittenberg, Germany, the University of Ouagadougou, Burkina Faso, the United Nations University Institute for Natural Resources in Africa, Ghana, the Federal University of Technology Akure Nigeria, and the AGRHYMET Regional Center in Niamey, Niger.

The Web Portal - DSS


What is a Decision Support System (DSS)?

  • It's an interactive and flexible computer based system
  • DSS's are used for the identification and solution of complex problems
  • Provides information to support making the best possible decision

Note

Decision support is neither a decision proposal nor a decision itself. This portal aims to give solid and efficient information in a comprehensive way.


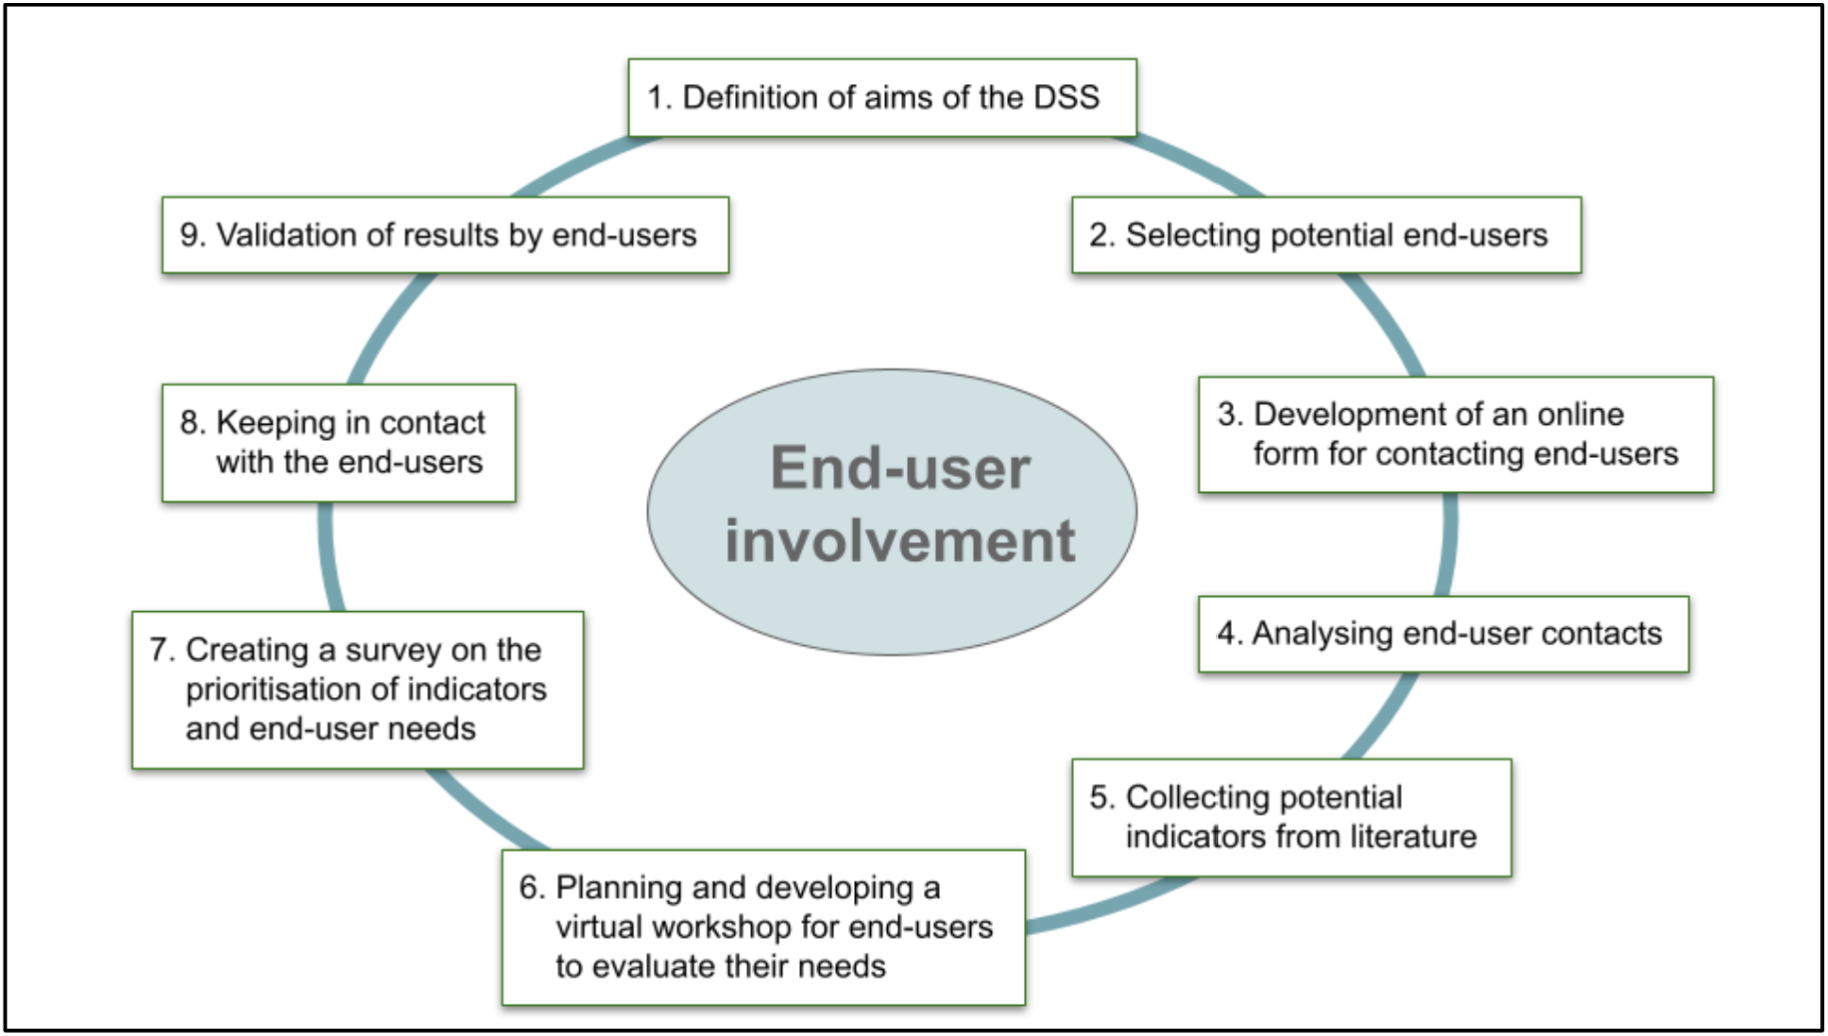
Evaluation of the DSS

An important part of the co-design and co-development process is the evaluation of the DSS by the stakeholders and users. To this end, the LANDSURF project conducted a virtual workshop on the evaluation of a beta version of the system in June 2023. In this workshop, up to 28 participants from various countries and institutions participated in the virtual workshop and provided feedback on the first application of the DSS. This was achieved by providing access to the system a few weeks in advance to give the stakeholders the opportunity to test the system and its user friendliness. During the workshop, the DSS was presented to the audience and application examples were given from the developers’ side. Further, feedback and additional input from the users were discussed and summarised in a complementing survey. The results are collected in the summary (english summary, french summary). The developers also provided some input to the stakeholders regarding further information planned to be included. A few weeks after the workshop, stakeholders and users were asked for their views on the DSS in a more detailed survey. All input we received helped to further develop the content and user friendliness of the DSS.


Spatial Decisions - SDSS

Our system can be described as a spatial decision support system (SDSS)

  • Maps play a decisive role in decision support processes
  • Usage of maps reduce decision time
  • Increases understandability and accuracy of the results
SDSS scheme

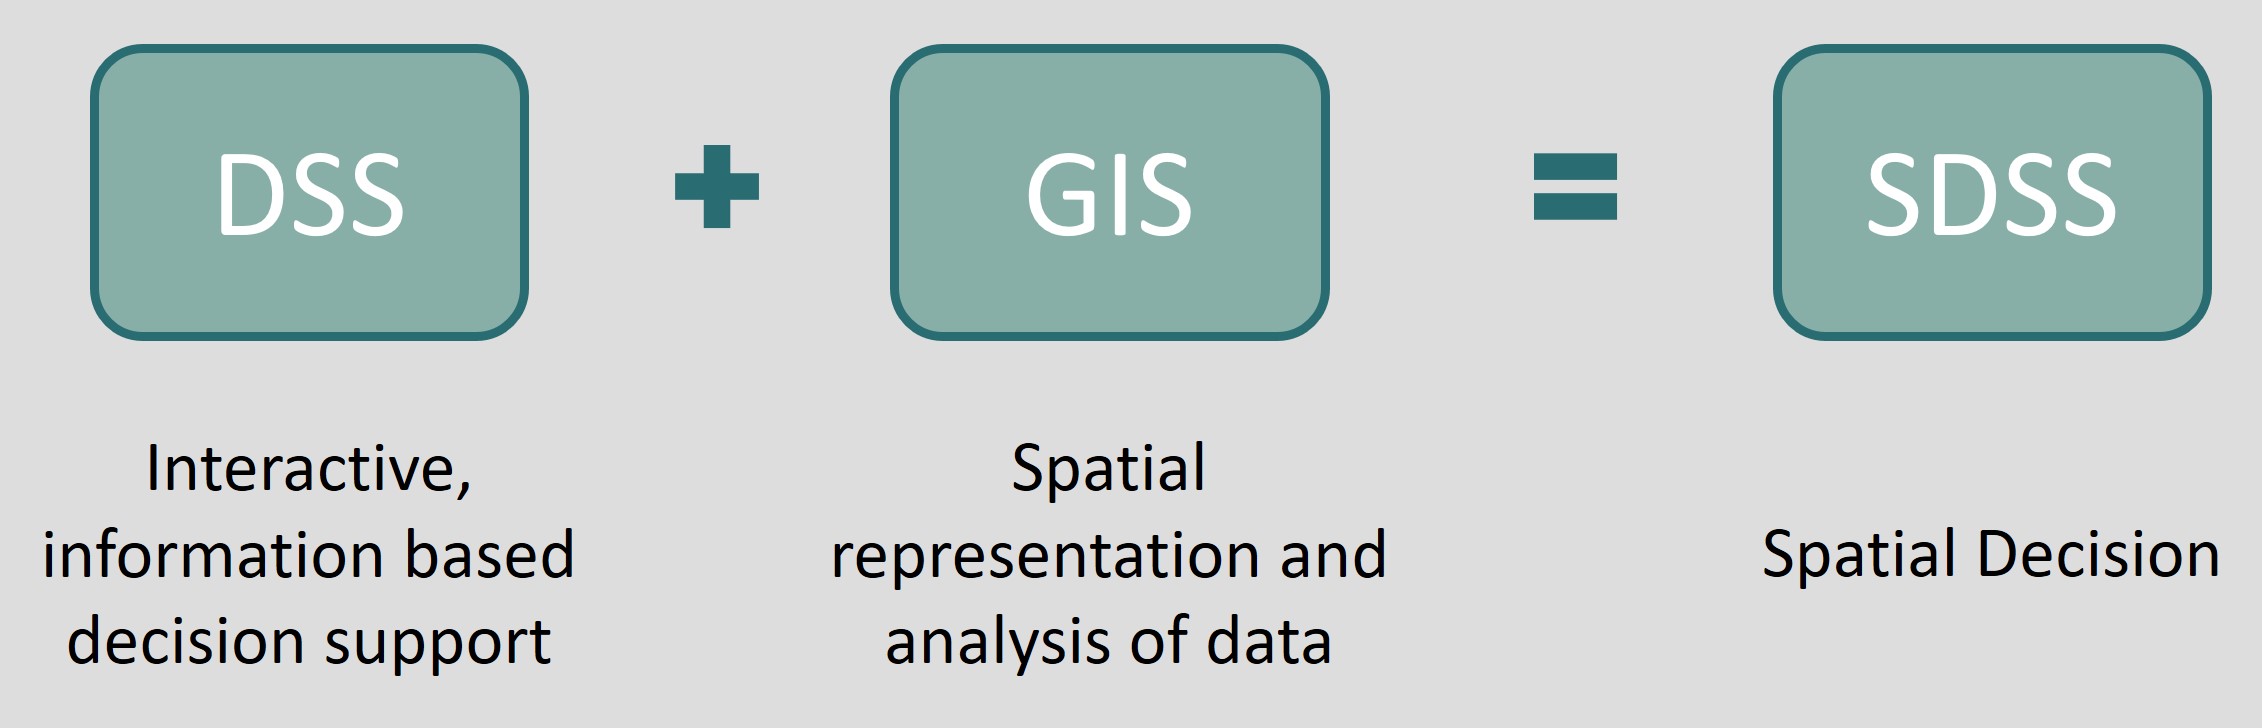
fig. 1: Scheme of a SDSS

Base Data

Data families

Observational (obs)

  • CHIRPS: Precipitation data (Satellite-based estimates combined with rain gauge measurements) (Funk et al., 2015)
  • ERA5-Land: Comprehensive climate dataset, including temperature, precipitation, humidity, and other variables (reanalysis, model data forced by measurements) (Muñoz-Sabater et al., 2021)

Model Data

The climate models used in our project are derived from CMIP5 (Taylor et al., 2012), a coordinated program of global climate models, and CORDEX-CORE (Giorgi et al., 2022), an initiative for regional climate models.

Note on model ensembles: We acknowledge our rcm and gcm ensembles are rather small. This limitation stems from the GCM-selection done to generate the CORDEX-CORE simulations (Giorgi et al., 2022). Beside the aforementioned gcms, the model HadGEM2-ES (Jones et al., 2011) and the RCM-simulations forced by it are also available but were dismissed because they only include a 360 day calendar which is not suitable for some of the provided indices. More details on the model data processing and usage within LANDSURF can be found in Abel et al. (2024).

Scenarios

The DSS provides data of the period 1981-2100. This period is divided into a historical period and the future period which is simulated under the assumption of two different greenhouse gas emission scenarios (Representative Concentration Pathway, RCPs) (van Vuuren et al., 2011):

  • hist (1981-2010): Historical simulation serving as a baseline.
  • rcp26 (2011-2100): Scenario with low greenhouse gas emissions.
  • rcp85 (2011-2100): Scenario with high greenhouse gas emissions.

Plants (Crop Indices only)

Available Crops

The parameters S and L describe the crop’s phase length.

S: Short Phase

L: Long Phase

  • Barley/Oats/Wheat S
  • Barley/Oats/Wheat L
  • Maize Grain S
  • Maize Grain L
  • Maize Sweet S
  • Maize Sweet L
  • Millet S
  • Millet L
  • Sorghum S
  • Sorghum L
  • Soybean S
  • Soybean L

Growth Stages

  • IS: Initial Stage
  • CDS: Crop Developing Stage
  • MSS: Mid Season Stage
  • LSS: Late Season Stage

The following table shows stage lengths and crop factors of selected crops (Allen et al., 1998).

Plant Parameter / Stages Initial Stage (IS) Crop Development Stage (CDS) Mid-Season Stage (MSS) Late-Season Stage (LSS)
Barley/Oats/Wheat Crop Factor (Kc) 0.35 0.75 1.15 0.45
Phase Length
Long 15 30 65 40
Short 15 25 50 30
Maize Grain Crop Factor (Kc) 0.4 0.8 1.15 0.7
Phase Length
Long 30 50 60 40
Short 20 35 40 30
Maize Sweet Crop Factor (Kc) 0.4 0.8 1.15 1.0
Phase Length
Long 20 30 50 10
Short 20 25 25 10
Millet Crop Factor (Kc) 0.35 0.7 1.1 0.65
Phase Length
Long 20 30 55 35
Short 15 25 40 35
Sorghum Crop Factor (Kc) 0.35 0.75 1.1 0.65
Phase Length
Long 20 35 45 30
Short 20 30 40 30
Soybean Crop Factor (Kc) 0.35 0.75 1.1 0.6
Phase Length
Long 20 30 70 30
Short 20 30 60 25

Calculation of Indices

Indices based on climate data

These are either observation or model based. The models used to generate the climate data are full physical models. Thus, the processes in the atmosphere, at the land surface etc. are calculated directly or are parameterised.

We calculate indices for each year when daily input data is available for all necessary variables. The requirement of multiple variables explains why some indices can't be calculated using CHIRPS, as it provides only precipitation data. However, ERA5-Land is available as observational input for all indices.

General Information on the Calculation:

All climatological and crop indices are based on the daily precipitation amount in mm and the maximum/minimum/mean daily 2-m temperature in °C at each grid point.

Note: For GCMs and observations, lon(i,1)=lon(i,j) for all j and lat(1,j)=lat(i,j) for all i, which means the coordinates are regular. For the RCMs this is not true. The variables lon and lat are two-dimensional because they are converted to a rotated coordinate system for the modelling where the grid is then equidistant and model output is rerotated to regular grid, but then the lon and lat are not equidistant anymore.

  • Observational: indices are calculated for every year from 1981 to 2010
  • Model data: indices are calculated for every year from 1981 to 2100

Calculation of the Rainy Season:

For the calculation of the rainy season, the method of Dunning et al. (2016) with modifications following Weber et al. (2018) was used as described in Abel et al. (2024). This method is a more specialised form of Liebmann et al. (2012). It is based on the calculation of accumulated daily precipitation anomalies where the minimum (maximum) refers to the onset (cessation) of the rainy season. Due to this, it is possible to detect not only the first, but also the second rainy season occurring in some regions.

In a first step, the climatological cumulative sum of the daily rainfall anomaly is determined at each grid box and afterwards smoothed using a 30-day-running mean. The minimum (maximum) of the climatological cumulative daily rainfall anomaly is considered as the onset (cessation) day of the climatological rainy season if the onset (cessation) day is lower (higher) than the four preceding and the four following days. If neither a minimum nor a maximum is found, the smoothing period is extended by 15 days until an equal number of minima and maxima is detected. Otherwise, a 120-day-running mean is achieved. Thereby, we assume that the first maximum after a preceding minimum defines a rainy season (Weber et al. 2018). In the case that more than two rainy seasons are detected, we consider only the two longest rainy seasons. Furthermore, if the number of days between two rainy seasons is less than 40 or if two rainy seasons overlap, one rainy season is assumed.

In a second step, the rainy season’s onset and cessation are determined for each year. This is done by calculating the cumulative rainfall anomaly (daily rainfall minus climatological daily mean rainfall over the period) and searching for the absolute minimum/maximum 20 days prior to the climatological onset date to 20 days past the climatological cessation date for each year.

Post Processing

  1. Spatial interpolation of each ensemble member to a common grid.
  2. Building of the ensemble mean, minimum, maximum, and standard deviation for each pixel and each year.
  3. Building of the running mean (± 15 years) for the ensemble means to eliminate the model variation and build climatologies (≥ 30 years) for a better comparison.

Available Values

Absolute values

= yearly value after post processing

The absolute value represents the yearly value of each index at every pixel within each data family. This is calculated after the post processing steps.


Historical mean of absolute value

= average absolute value from 1981-2010

The historical mean of the absolute values is calculated as the average of the values from the period 1981-2010 for each index and data family.


Difference to historical value

= (yearly absolute values) - (historical mean of absolute values)

The difference is calculated by subtracting the historical mean of the absolute values from the yearly absolute values for each index and data family.


"Bias Adjusted" absolute value for model data

= (difference to historical value) + (historical mean of ERA5-land)

= (yearly value of model data - historical mean of absolute value of model data) + (historical mean of ERA5-land)*
*except spi and spei, which are adjusted monthly because their output is also monthly. Afterwards, the mean of monthly values is calculated to create yearly values.

All model data were bias adjusted by adding the difference between the future scenario data and the historical mean model data to the historical mean of the reference data ERA5-Land. This is the so-called delta method. It assumes that the model bias at each pixel (grid cell) remains constant over time and is eliminated by the subtraction (Maraun and Widmann, 2018).

Rather than displaying direct model output, we present adjusted values to address known systematic errors (biases) in both GCMs and RCMs. Our approach involves calculating the projected change within each model relative to its historical values. This change is added to historical observational data. Thus, model biases are eliminated and the modelled change over time is emphasised which is a strength of climate models as they can represent the overall trend very well. We use ERA5-Land data as a baseline to represent absolute values, with modelled changes added to reflect absolute future projections instead of showing differences.


Trend

(only for model data)

= b * 10

b = regression coefficient in y = bx + a

generated from yearly values from 2001-2100 for each pixel and index.

The trend is calculated from the linear trend equation of the original model data from 2001-2100 with time as the independent variable and the respective index value as the dependent variable. To assess the significance of the trend, the slope b is tested using a two-sided hypothesis test with a significance level of 95% (Wilks, 2020).

Note

Only significant values of b are shown, the trend of all other pixels is set to zero.


Signal-to-Noise-Ratio

(only for model data)

Signal = Trend
Noise = standard deviation of the models

= trend / ensemble standard deviation

The strength of the trend is quantified by dividing it by the standard deviation of the model ensemble to obtain a trend-noise ratio. This also allows the trend comparison of different indices, as the magnitude of the units is eliminated.

The classification of the TNR is based on Rapp (2000) and Land and Büter (2023).

The TNR indicates how confident we are about the change shown in a trend. A more extreme TNR class means a higher change probability because all the models contributing to the analysis agree on the trend's direction.

More information about the TNR can be derived from Hennemuth et al. (2013).

TNR Value Interpretation Symbol
TNR ≥2 strong positive trend
1 ≤ TNR < 2 positive trend
-1 < TNR < 1 no trend
-2 < TNR ≤ -1 negative trend
TNR ≤ -2 strong negative trend

Indices based on remote sensing data

These indices are based on statistical models extrapolating observed data in high resolution to time periods where only coarser data were available based on the statistical relationship between the data during their temporal overlap.

The processing routine for the remote sensing indices NDVI and LAI is based on predictive models for estimating iteratively the new land surface parameter datasets for West Africa using historical satellite data, focussing on enhancing spatial resolution and accuracy. For data preparation, the spatially higher resolved MODIS data sets were resampled to 1 km pixel size using nearest neighbour for initial processing. Afterwards, 12 monthly composites were created for each dataset (2003-2022) using mean values to capture seasonal variations. As machine learning models, XGBoost and Random Forest models were utilized since they are well established methods, known for their effectiveness in spatio-temporal data analysis. From those 12 monthly composites training and testing datasets were generated to train the models using the MODIS data values and the corresponding month as features. The tested models were evaluated using accuracy metrics such as MAE, RMSE and R2. In the following, only XGBoost was used, as it outperformed Random Forest for efficiency. Based on XGBoost models, MODIS-like datasets at 1 km spatial resolution were predicted from historical AVHRR data to generate monthly raster predictions for 1981-2022. All analyses were conducted using the programming language Python.

Available Indices

Indices based on climate data

Selection of Indices

The climate indicators presented in the Decision Support System (DSS) have been carefully selected in dialogue with different stakeholders to reflect their interests and needs. While we may not have information for every possible question, we conducted workshops and a survey with stakeholders and potential users during the selection process to identify the most useful indicators for decision making. The entire process of selecting the climate indicators, as well as the co-development and co-design of the DSS, was recorded and summarised in an interaction protocol (fig. 2) (Weber et al., 2023).

SDSS scheme

Fig. 2: Implementation process for user involvement and selection of climate indicators

The indices listed in the DSS received a user score of at least 50% in the survey and were calculated from the observational, reanalysis and climate model data with the required temporal and spatial resolution. An assessment of selected climate indicators calculated from climate model data has been undertaken and can be found in Abel et al. (2024).

Climate Indices

Abbreviation Long Name Explanation Category Unit
dd Number of dry days Annual number of dry days with daily rainfall < 1 mm Drought [days]
ddrs Number of dry days in rainy season Annual number of days with rainfall < 1 mm in rainy season Drought, Rainy Season [days]
cddrs Consecutive dry days in rainy season Maximum number of consecutive days with rainfall < 1 mm in rainy season Drought, Rainy Season [days]
cwdi Cold wave duration index Number of days in interval of at least 6 days with min. temperature < -5°C mean (mean calculated on daily basis of a reference period using running 5 day mean) Extreme temperature [days]
etr Extreme temperature range Difference between max. and min. temperature Extreme temperature [K]
hwdi Heat wave duration index Number of days in interval of at least 6 days with max. temperature > 5°C mean (mean calculated on daily basis of a reference period using running 5 day mean) Extreme temperature [days]
hwfi Warm spell days Number of days in interval of at least 6 days with temperature > 90th percentile (mean calculated on daily basis of a reference period using running 5 day mean) Extreme temperature [days]
tn10p Extreme cold nights Percentage of days with min. temperature < 10th percentile of a calculated period Extreme temperature [%]
tx35 Hot days Percentage of days with max. temperature > 35°C Extreme temperature [days]
tn90p Warm nights Percentage of days with min. temperature > 90th percentile of a calculated period Extreme temperature [%]
tx90p Extreme warm days Number of days with max. temperature > 90th percentile of a calculated period Extreme temperature [%]
rx1day Annual maximum 1-day rainfall maximum rainfall during one day Rainfall [mm]
r99p Extreme daily rainfall intensity 99th percentile of daily rainfall Rainfall [mm]
r99prs Extreme daily rainfall intensity during rainy season 99th percentile of daily rainfall in rainy season Rainfall, Rainy Season [mm]
rtot Total rainfall amount from wet days Annual total amount of rainfall on days with precipitation >= 1 mm Rainfall [mm]
rtotrs Total rainfall amount from wet days in rainy season Annual total amount of rainfall on days with precipitation >= 1 mm in rainy season Rainfall, Rainy Season [mm]
rd Number of wet days Annual number of days with rainfall >= 1 mm Rainfall [days]
rdrs Number of wet days in rainy season Annual number of days with rainfall >= 1 mm in rainy season Rainfall, Rainy Season [days]
cwdrs Consecutive wet days in rainy season Maximum number of consecutive days with rainfall >= 1 mm in rainy season Rainfall, Rainy Season [days]
rs1 First rainy season Day of onset and cessation of first rainy season Rainy Season [day of year]
rs2 Second rainy season Day of onset and cessation of second rainy season Rainy Season [day of year]

Drought Indices

Abbreviation Long Name Explanation Category Unit
spi Standardized Precipitation Index Index to characterize drought on different timescales Drought [Index]
spei Standardized Precipitation Evapotranspiration Index Extension of the Standardized Precipitation Index including potential evapotranspiration, thus, representing the temperature signal as well Drought [Index]

The SPI and SPEI can be categorised into different classes that represent more or less severely dry or wet periods. The used classification is based on the following articles from DWD, GERICS , and Liu et al. (2024)

Value range Interpretation
SPI/SPEI ≥ 2.0 Extremely wet
1.5 ≤ SPI/SPEI < 2.0 Severely wet
1.0 ≤ SPI/SPEI < 1.5 Moderately wet
0 < SPI/SPEI < 1.0 Normal (slightly wet)
-1.0 ≤ SPI/SPEI < 0.0 Normal (mild drought)
-1.5 ≤ SPI/SPEI < -1.0 Moderate drought
-2.0 ≤ SPI/SPEI < -1.5 Severe drought
SPI/SPEI ≤ -2.0 Extreme drought

Crop Indices

Abbreviation Long Name Explanation Unit
ir Irrigation water requirement Daily water balance of the root zone [mm]
wa Water availability Water available for crop growth [mm]
cwn Crop water needs Water consumed during the growing season [mm]

Indices based on remote sensing data


Abbreviation Long Name Explanation
NDVI Normalized Difference Vegetation Index Index of the greenness of vegetation and thus closely linked to vegetation density and productivity (Tucker & Sellers, 1986). The NDVI is calculated using the spectral reflectance measurements of the red and infrared (NIR) wavelength and can range from -1 to +1.
LAI Leaf Area Index The Leaf Area Index (LAI) is a dimensionless variable, quantifying the total one-sided area of green leaves (in m²) per surface area (in m²). The LAI corresponds to the total of the canopy also including the understory layers (Sellers, 1985) and is an Essential Climate Variable (ECV) defined by the Global Climate Observing System (GTOS, 2009).


NDVI Value Range

Value Range Interpretation
≤ 0 Water, non-vegetated surfaces
0 < 0.3 Nearly no vegetation
0.3 < 0.6 Sparse vegetation
0.6 < 0.9 Healthy vegetation
≥ 0.9 Very dense, healthy vegetation


LAI Value Range

Value Range Interpretation
≤ 1 Non-vegetated surfaces
1 < 3 Sparse vegetation
3 < 6 Shrublands, Woodlands
7 < 10 Dense tropical forests

Cite our Data

The DSS

The DSS:
König, L., Ziegler, K., Abel, D., Weber, T., Teucher, M., Otte, I., Ajayi, V., Gbode, I. E., Zoungrana, B. J., Coulibaly, A., Schuck-Zöller, S., Máñez Costa, M., Thiel, M., Paeth, H., Conrad, C. (2024). LANDSURF DSS. https://doi.org/10.5281/zenodo.13318593

Downloaded data:
https://doi.org/10.58160/gGzexcbDikobkyvK

Scientific background

Raw data before processing for the DSS:

Ziegler, K., Abel, D., & Paeth, H. (2024). https://doi.org/10.58160/99

Peer-reviewed publications:

Abel, D., Ziegler, K., Gbode, I. E., Weber, T., Ajayi, V. O., Traoré, S. B., & Paeth, H. (2024). Robustness of climate indices relevant for agriculture in Africa deduced from GCMs and RCMs against reanalysis and gridded observations. Climate Dynamics, 62, 1077-1106. https://doi.org/10.1007/s00382-023-06956-8

Ziegler, K., Abel, D., Weber, T., & Paeth, H. (). Development of climate indices relevant for agriculture in Africa under different climate change scenarios based on GCM and RCM ensembles. Under review for Environmental Research: Climate

References

Abel, D., Ziegler, K., Gbode, I. E., Weber, T., Ajayi, V. O., Traoré, S. B., & Paeth, H. (2024). Robustness of climate indices relevant for agriculture in Africa deduced from GCMs and RCMs against reanalysis and gridded observations. Climate Dynamics, 62, 1077–1106. https://doi.org/10.1007/s00382-023-06956-8

Allen, R., Pereira, L., & Smith, M. (1998). Crop evapotranspiration: Guidelines for computing crop water requirements. FAO irrigation and drainage paper: Vol. 56. Rome: Food and Agriculture Organization of the United States. Retrieved from https://www.fao.org/3/X0490E/x0490e00.htm

Bentsen, M., Bethke, I., Debernard, J. B., Iversen, T., Kirkevåg, A., Seland, Ø., Drange, H., Roelandt, C., Seierstad, I. A., Hoose, C., & Kristjánsson, J. E. (2013). The Norwegian Earth System Model, NorESM1-M – Part 1: Description and basic evaluation of the physical climate. Geoscientific Model Development, 6, 687–720. https://doi.org/10.5194/gmd-6-687-2013

Dunning, C. M., Black, E. C. L., & Allan, R. P. (2016). The onset and cessation of seasonal rainfall over Africa. Journal of Geophysical Research Atmospheres, 121(19), 11405–11424. https://doi.org/10.1002/2016JD025428

Funk, C., Peterson, P., Landsfeld, M., Pedreros, D., Verdin, J., Shukla, S., Husak, G., Rowland, J., Harrison, L., Hoell, A., & Michaelsen, J. (2015). The climate hazards infrared precipitation with stations - a new environmental record for monitoring extremes. Scientific Data, 2, 150066. https://doi.org/10.1038/sdata.2015.66

Giorgetta, M. A., Roeckner, E., Mauritsen, T., Bader, J., Crueger, T., Esch, M., Rast, S., Kornblueh, L., Schmidt, H., Kinne, S., Hohenegger, C., Möbis, B., Krismer, T., Wieners, K.‑H., & Stevens, B. (2013). The atmospheric general circulation model ECHAM6: Model description (Reports on Earth System Science 0937-1060). https://doi.org/10.1029/2010JD014036

Giorgi, F., Coppola, E., Jacob, D., Teichmann, C., Omar, S. A., Ashfaq, M., Ban, N., Bülow, K., Bukovsky, M., Buntemeyer, L., Cavazos, T., Ciarlo, J., Da Rocha, R. P., Das, S., Di Sante, F., Evans, J. P., Gao, X., Giuliani, G., Glazer, R. H., . . . Weber, T. (2022). The CORDEX-CORE EXP-I initiative: Description and highlight results from the initial analysis. Bulletin of the American Meteorological Society, 103(2), E293-E310. https://doi.org/10.1175/BAMS-D-21-0119.1

Giorgi, F., Coppola, E., Solmon, F., Mariotti, L., Sylla, M. B., Bi, X., Elguindi, N., Diro, G. T., Nair, V., Giuliani, G., Turuncoglu, U. U., Cozzini, S., Güttler, I., O'Brien, T. A., Tawfik, A. B., Shalaby, A., Zakey, A. S., Steiner, A. L., Stordal, F., . . . Brankovic, C. (2012). RegCM4: Model description and preliminary tests over multiple CORDEX domains. Climate Research, 52, 7–29. https://doi.org/10.3354/cr01018

GLOBAL TERRESTRIAL OBSERVING SYSTEM (GTOS) (2009). LAI. Assessment of the status of the development of the standards for the terrestrial essential climate variables. GTOS 66. http://www.fao.org/gtos/doc/ECVs/T11/T11.pdf

Hennemuth, B., Bender, S., Bülow, K., Dreier, N., Keup-Thiel, E., Krüger, O., Mudersbach, C., Radermacher, C., & Schoetter, R. (2013). Statistical methods for the analysis of simulated and observed climate data, applied in projects and institutions dealing with climate change impact and adaptation. CSC Report 13, Climate Service Center, Germany. Retrieved from https://www.climate-service-center.de/imperia/md/content/csc/projekte/csc-report13_engl.pdf

Jacob, D., Elizalde, A., Haensler, A., Hagemann, S., Kumar, P., Podzun, R., Rechid, D., Remedio, A. R. C., Saeed, F., Sieck, K., Teichmann, C., & Wilhelm, C. (2012). Assessing the transferability of the regional climate model REMO to different coordinated regional climate downscaling experiment (CORDEX) regions. Atmosphere, 3(1), 181–199. https://doi.org/10.3390/atmos3010181

Jacob, D., & Podzun, R. (1997). Sensitivity studies with the regional climate model REMO. Meteorology and Atmospheric Physics, 63(1-2), 119–129. https://doi.org/10.1007/BF01025368

Jones, C. D., Hughes, J. K., Bellouin, N., Hardiman, S. C., Jones, G. S., Knight, J., Liddicoat, S., O'Connor, F. M., Andres, R. J., Bell, C., Boo, K. O., Bozzo, A., Butchart, N., Cadule, P., Corbin, K. D., Doutriaux-Boucher, M., Friedlingstein, P., Gornall, J., Gray, L., . . . Zerroukat, M. (2011). The HadGEM2-ES implementation of CMIP5 centennial simulations. Geoscientific Model Development, 4(3), 543–570. https://doi.org/10.5194/gmd-4-543-2011

Land, C. & Büter, B. (last updated 2023). Grundlagen und Empfehlungen für eine Klimaanpassungsstrategie der Region Hannover. Retrieved from https://www.hannover.de/Leben-in-der-Region-Hannover/Umwelt-Nachhaltigkeit/Klimawandel-und-anpassung/Die-Region-Hannover-im-Klimawandel/Gutachten-zur-Klimaanpassung

Liebmann, B., Bladé, I., Kiladis, G. N., Carvalho, L. M. V., Senay, G. B., Allured, D., Leroux, S., & Funk, C. (2012). Seasonality of African Precipitation from 1996 to 2009. Journal of Climate, 25(12), 4304–4322. https://doi.org/10.1175/JCLI-D-11-00157.1

Liu, X., Yu, S., Yang, Z., Dong, J., & Peng, J. (2024). The first global multi-timescale daily SPEI dataset from 1982 to 2021. Scientific Data, 11, 223. https://doi.org/10.1038/s41597-024-03047-z

Maraun, D. & Widmann, M. (2018). Statistical downscaling and bias correction for climate research, Cambridge University Press, Cambridge, UK, 2018. https://doi.org/10.1017/9781107588783

Muñoz-Sabater, J., Dutra, E., Agustí-Panareda, A., Albergel, C., Arduini, G., Balsamo, G., Boussetta, S., Choulga, M., Harrigan, S., Hersbach, H., Martens, B., Miralles, D. G., Piles, M., Rodríguez-Fernández, N. J., Zsoter, E., Buontempo, C., & Thépaut, J.‑N. (2021). ERA5-Land: a state-of-the-art global reanalysis dataset for land applications. Earth System Science Data, 13, 4349–4383. https://doi.org/10.5194/essd-13-4349-2021

Rapp, J. (2000). Problematik und Ergebnisse klimatologischer Trendanalysen für Europa und Deutschland. Offenbach (Berichte des Deutschen Wetterdienstes: 212). ISBN 978-3-88148-365-0. Retrieved from https://www.dwd.de/DE/leistungen/pbfb_verlag_berichte/pdf_einzelbaende/212_pdf.pdf;jsessionid=B3D5AA2D7045470C42333B7DAAD67221.live31082?__blob=publicationFile&v=5

Remedio, A. R. C., Teichmann, C., Buntemeyer, L., Sieck, K., Weber, T., Rechid, D., Hoffmann, P., Nam, C., Kotova, L., & Jacob, D. (2019). Evaluation of New CORDEX Simulations Using an Updated Köppen–Trewartha Climate Classification. Atmosphere, 10(11), 726. https://doi.org/10.3390/atmos10110726

Sellers, P. J. (1985). Canopy reflectance, photosynthesis and transpiration. Int J Remote Sens, 6, 1335–1372.

Sørland, S. L., Brogli, R., Pothapakula, P. K., Russo, E., van de Walle, J., Ahrens, B., Anders, I., Bucchignani, E., Davin, E. L., Demory, M.‑E., Dosio, A., Feldmann, H., Früh, B., Geyer, B., Keuler, K., Lee, D., Li, D., van Lipzig, N. P., Min, S.‑K., . . . Thiery, W. (2021). COSMO-CLM Regional Climate Simulations in the CORDEX framework: a review. Geoscientific Model Development, 14, 5125–5154. https://doi.org/10.5194/gmd-2020-443

Taylor, K. E., Stouffer, R. J., & Meehl, G. A. (2012). An overview of CMIP5 and the experiment design. Bulletin of the American Meteorological Society, 93(4), 485–498. https://doi.org/10.1175/BAMS-D-11-00094.1

Tucker, C. J. & Sellers, P. J. (1986). Satellite remote sensing of primary production. Int. J. Remote Sens., 7, 1395–1416.

van Vuuren, D. P., Edmonds, J., Kainuma, M., Riahi, K., Thomson, A., Hibbard, K., Hurtt, G. C., Kram, T., Krey, V., Lamarque, J. F. , Masui, T., Meinshausen, M, Nakicenovic, N., Smith, S. J., & Rose, S. K. (2011). The representative concentration pathways: An overview. Climatic Change, 109, 5. https://doi.org/10.1007/s10584-011-0148-z

Weber, T., Gbode, I. E., Ziegler, K., Abel, D., Ajayi, V. O., Otte, I., Zoungrana, B. J.-B., Coulibaly, A., Máñez Costa, M., Guillén Bolaños, T., Muwafu, S. & Paeth, H. (2023). Users’ interaction protocol to identify specific climate indicators and end-user needs for the development of a decision support system (DSS). WASCAL WRAP2.0: LANDSURF project. Retrieved from https://www.climate-service-center.de/imperia/md/content/csc/gerics/wascal_landsurf_end-user_interaction_protocol.pdf

Weber, T., Haensler, A., Rechid, D., Pfeifer, S., Eggert, B., & Jacob, D (2018). Analyzing Regional Climate Change in Africa in a 1.5, 2, and 3°C Global Warming World. Earth's Future, 6(4), 643–655. https://doi.org/10.1002/2017EF000714

Wilks, D. S., (2020). Statistical Methods in the Atmospheric Sciences. 4th ed. Elsevier, 840 pp. https://doi.org/10.1016/C2017-0-03921-6

Imprint - Legal Information

Imprint

Information pursuant to Sect. 5 German Telemedia Act (TMG)

Publisher

Martin-Luther-University Halle-Wittenberg
Institute of Geosciences and Geography
Department Geoecology
Von-Seckendorff-Platz 4, 06120 Halle (Saale)


Contact

lorenz.koenig@geo.uni-halle.de


Copyright

All rights reserved, Martin Luther University Halle-Wittenberg, Institute of Geosciences, Department of Geoecology, 06120 Halle (Saale).

The online documents and web pages of the Website including their parts are protected by copyright. They may only be copied and printed for private, scientific and non-commercial use for information purposes if they contain the copyright notice.

Martin Luther University Halle-Wittenberg reserves the right to revoke this permission at any time. Without the prior written permission of the Martin Luther University Halle-Wittenberg, these documents/web pages may not be reproduced, archived, stored on another server, included in newsgroups, used in online services or stored on other data carriers. They may, however, be copied into a cache or proxy server to optimise access speed. We expressly permit and welcome the citation of our documents and web pages as well as the setting of links to the web content.

Licenses

The LANDSURF Website uses various Open Source Software Packages. Following is a table of the packages used and their corresponding license.

Package License Copyright
Bootstrap MIT License Copyright (c) 2011-2023 Twitter, Inc., Copyright (c) 2011-2023 The Bootstrap Authors
jQuery MIT License Copyright (c) 2023 OpenJS Foundation
Openlayers BSD 2-Clause License Copyright 2005-present, OpenLayers Contributors All rights reserved.
ol-layerswitcher MIT License Copyright (c) 2023 Matt Walker
Datatables MIT License Copyright (C) 2008-2023, SpryMedia Ltd.
jQuery Datatables MIT License Copyright (c) 2016 Mohd Khairi
Chart.js MIT License Copyright (c) 2014-2023 Chart.js Contributors
Tippy.js License Copyright (c) 2017-present atomiks
Boarding.js MIT License Copyright (c) Josias Ribi
print.js MIT License Copyright (c) Rodrigo Vieira
jsZip MIT License Copyright (c) Stuart Knightley
jsPDF MIT License Copyright (c) James Hall, yWorks GmbH
Fontawesome Fonts SIL OFL 1.1 License Copyright (c) 2023 Fonticons, Inc.
Fontawesome Icons CC BY 4.0 License Copyright (c) 2023 Fonticons, Inc.
Fontawesome Code MIT License Copyright (c) 2023 Fonticons, Inc.
Geoserver GNU General Public License Version 2.0 Copyright (C) 2014-2023 Open Source Geospatial Foundation
Tomcat Apache License, Version 2.0 Copyright © 2023 The Apache Software Foundation
Apache Apache License, Version 2.0 Copyright © 2023 The Apache Software Foundation
Documentation Bootstrap Template GNU General Public License Copyright © 2024 Xiaoying Riley
NoUiSlider MIT License Copyright © 2019 Léon Gersen
Luxon MIT License Copyright © 2019 JS Foundation and other contributors

Disclaimer

Content

The author accepts no responsibility for the topicality, correctness, completeness or quality of the information provided. Liability claims against the author relating to material or non-material damage caused by the use or non-use of the information provided or by the use of incorrect or incomplete information are excluded as a matter of principle, insofar as there is no demonstrable intentional or grossly negligent fault on the part of the author. All offers are subject to change and non-binding. The author expressly reserves the right to change, supplement or delete parts of the pages or the entire offer without separate announcement or to discontinue publication temporarily or permanently.

References / Links

The author is not responsible for any contents linked or referred to from his pages - unless he has full knowledge of illegal contents and would be able to prevent the visitors of his site fromviewing those pages. The author hereby expressly declares that at the time the links were created, no illegal content was discernible on the linked pages. The author has no influence on the current and future design, content or authorship of the linked pages. For this reason, he hereby expressly distances himself from all content of all linked pages that were changed after the link was created. This statement applies to all links and references set within the author's own website as well as to external entries in guest books, discussion forums and mailing lists set up by the author. Liability for illegal, incorrect or incomplete content and in particular for damages arising from the use or non-use of such information lies solely with the provider of the page to which reference is made, and not with the party who merely refers to the respective publication via links.

Copyright & Trademark Law

The author endeavours to observe the copyrights of the graphics and texts used in all publications, to use graphics and texts created by himself or to resort to licence-free graphics and texts. All brand names and trademarks mentioned on the website and possibly protected by third parties are subject without restriction to the provisions of the applicable trademark law and the ownership rights of the respective registered owners. The mere mention of a trademark does not imply that it is not protected by the rights of third parties!

Privacy Policy

We are very delighted that you have shown interest in our enterprise. Data protection is of a particularly high priority for the management of the Martin Luther University Halle-Wittenberg. The use of the Internet pages of the Martin Luther University Halle-Wittenberg is possible without any indication of personal data; however, if a data subject wants to use special enterprise services via our website, processing of personal data could become necessary. If the processing of personal data is necessary and there is no statutory basis for such processing, we generally obtain consent from the data subject.

The processing of personal data, such as the name, address, e-mail address, or telephone number of a data subject shall always be in line with the General Data Protection Regulation (GDPR), and in accordance with the country-specific data protection regulations applicable to the Martin Luther University Halle-Wittenberg. By means of this data protection declaration, our enterprise would like to inform the general public of the nature, scope, and purpose of the personal data we collect, use and process. Furthermore, data subjects are informed, by means of this data protection declaration, of the rights to which they are entitled.

As the controller, the Martin Luther University Halle-Wittenberg has implemented numerous technical and organizational measures to ensure the most complete protection of personal data processed through this website. However, Internet-based data transmissions may in principle have security gaps, so absolute protection may not be guaranteed. For this reason, every data subject is free to transfer personal data to us via alternative means, e.g. by telephone.

1. Definitions

The data protection declaration of the Martin Luther University Halle-Wittenberg is based on the terms used by the European legislator for the adoption of the General Data Protection Regulation (GDPR). Our data protection declaration should be legible and understandable for the general public, as well as our customers and business partners. To ensure this, we would like to first explain the terminology used.

In this data protection declaration, we use, inter alia, the following terms:

  • a)    Personal data

    Personal data means any information relating to an identified or identifiable natural person (“data subject”). An identifiable natural person is one who can be identified, directly or indirectly, in particular by reference to an identifier such as a name, an identification number, location data, an online identifier or to one or more factors specific to the physical, physiological, genetic, mental, economic, cultural or social identity of that natural person.

  • b) Data subject

    Data subject is any identified or identifiable natural person, whose personal data is processed by the controller responsible for the processing.

  • c)    Processing

    Processing is any operation or set of operations which is performed on personal data or on sets of personal data, whether or not by automated means, such as collection, recording, organisation, structuring, storage, adaptation or alteration, retrieval, consultation, use, disclosure by transmission, dissemination or otherwise making available, alignment or combination, restriction, erasure or destruction.

  • d)    Restriction of processing

    Restriction of processing is the marking of stored personal data with the aim of limiting their processing in the future.

  • e)    Profiling

    Profiling means any form of automated processing of personal data consisting of the use of personal data to evaluate certain personal aspects relating to a natural person, in particular to analyse or predict aspects concerning that natural person's performance at work, economic situation, health, personal preferences, interests, reliability, behaviour, location or movements.

  • f)     Pseudonymisation

    Pseudonymisation is the processing of personal data in such a manner that the personal data can no longer be attributed to a specific data subject without the use of additional information, provided that such additional information is kept separately and is subject to technical and organisational measures to ensure that the personal data are not attributed to an identified or identifiable natural person.

  • g)    Controller or controller responsible for the processing

    Controller or controller responsible for the processing is the natural or legal person, public authority, agency or other body which, alone or jointly with others, determines the purposes and means of the processing of personal data; where the purposes and means of such processing are determined by Union or Member State law, the controller or the specific criteria for its nomination may be provided for by Union or Member State law.

  • h)    Processor

    Processor is a natural or legal person, public authority, agency or other body which processes personal data on behalf of the controller.

  • i)      Recipient

    Recipient is a natural or legal person, public authority, agency or another body, to which the personal data are disclosed, whether a third party or not. However, public authorities which may receive personal data in the framework of a particular inquiry in accordance with Union or Member State law shall not be regarded as recipients; the processing of those data by those public authorities shall be in compliance with the applicable data protection rules according to the purposes of the processing.

  • j)      Third party

    Third party is a natural or legal person, public authority, agency or body other than the data subject, controller, processor and persons who, under the direct authority of the controller or processor, are authorised to process personal data.

  • k)    Consent

    Consent of the data subject is any freely given, specific, informed and unambiguous indication of the data subject's wishes by which he or she, by a statement or by a clear affirmative action, signifies agreement to the processing of personal data relating to him or her.

2. Name and Address of the controller

Controller for the purposes of the General Data Protection Regulation (GDPR), other data protection laws applicable in Member states of the European Union and other provisions related to data protection is:

Martin Luther University Halle-Wittenberg

Van-Seckendorff-Platz 4

06120 Halle (Saale)

Germany

Phone: +49/345/5526061

Email: lorenz.koenig@geo.uni-halle.de

Website: landsurf.geo.uni-halle.de

3. Cookies

The Internet pages of the Martin Luther University Halle-Wittenberg use cookies. Cookies are text files that are stored in a computer system via an Internet browser.

Many Internet sites and servers use cookies. Many cookies contain a so-called cookie ID. A cookie ID is a unique identifier of the cookie. It consists of a character string through which Internet pages and servers can be assigned to the specific Internet browser in which the cookie was stored. This allows visited Internet sites and servers to differentiate the individual browser of the dats subject from other Internet browsers that contain other cookies. A specific Internet browser can be recognized and identified using the unique cookie ID.

Through the use of cookies, the Martin Luther University Halle-Wittenberg can provide the users of this website with more user-friendly services that would not be possible without the cookie setting.

By means of a cookie, the information and offers on our website can be optimized with the user in mind. Cookies allow us, as previously mentioned, to recognize our website users. The purpose of this recognition is to make it easier for users to utilize our website. The website user that uses cookies, e.g. does not have to enter access data each time the website is accessed, because this is taken over by the website, and the cookie is thus stored on the user's computer system. Another example is the cookie of a shopping cart in an online shop. The online store remembers the articles that a customer has placed in the virtual shopping cart via a cookie.

The data subject may, at any time, prevent the setting of cookies through our website by means of a corresponding setting of the Internet browser used, and may thus permanently deny the setting of cookies. Furthermore, already set cookies may be deleted at any time via an Internet browser or other software programs. This is possible in all popular Internet browsers. If the data subject deactivates the setting of cookies in the Internet browser used, not all functions of our website may be entirely usable.

4. Collection of general data and information

The website of the Martin Luther University Halle-Wittenberg collects a series of general data and information when a data subject or automated system calls up the website. This general data and information are stored in the server log files. Collected may be (1) the browser types and versions used, (2) the operating system used by the accessing system, (3) the website from which an accessing system reaches our website (so-called referrers), (4) the sub-websites, (5) the date and time of access to the Internet site, (6) an Internet protocol address (IP address), (7) the Internet service provider of the accessing system, and (8) any other similar data and information that may be used in the event of attacks on our information technology systems.

When using these general data and information, the Martin Luther University Halle-Wittenberg does not draw any conclusions about the data subject. Rather, this information is needed to (1) deliver the content of our website correctly, (2) optimize the content of our website as well as its advertisement, (3) ensure the long-term viability of our information technology systems and website technology, and (4) provide law enforcement authorities with the information necessary for criminal prosecution in case of a cyber-attack. Therefore, the Martin Luther University Halle-Wittenberg analyzes anonymously collected data and information statistically, with the aim of increasing the data protection and data security of our enterprise, and to ensure an optimal level of protection for the personal data we process. The anonymous data of the server log files are stored separately from all personal data provided by a data subject.

5. Contact possibility via the website

The website of the Martin Luther University Halle-Wittenberg contains information that enables a quick electronic contact to our enterprise, as well as direct communication with us, which also includes a general address of the so-called electronic mail (e-mail address). If a data subject contacts the controller by e-mail or via a contact form, the personal data transmitted by the data subject are automatically stored. Such personal data transmitted on a voluntary basis by a data subject to the data controller are stored for the purpose of processing or contacting the data subject. There is no transfer of this personal data to third parties.

6. Routine erasure and blocking of personal data

The data controller shall process and store the personal data of the data subject only for the period necessary to achieve the purpose of storage, or as far as this is granted by the European legislator or other legislators in laws or regulations to which the controller is subject to.

If the storage purpose is not applicable, or if a storage period prescribed by the European legislator or another competent legislator expires, the personal data are routinely blocked or erased in accordance with legal requirements.

7. Rights of the data subject

  • a) Right of confirmation

    Each data subject shall have the right granted by the European legislator to obtain from the controller the confirmation as to whether or not personal data concerning him or her are being processed. If a data subject wishes to avail himself of this right of confirmation, he or she may, at any time, contact any employee of the controller.

  • b) Right of access

    Each data subject shall have the right granted by the European legislator to obtain from the controller free information about his or her personal data stored at any time and a copy of this information. Furthermore, the European directives and regulations grant the data subject access to the following information:

    • the purposes of the processing;
    • the categories of personal data concerned;
    • the recipients or categories of recipients to whom the personal data have been or will be disclosed, in particular recipients in third countries or international organisations;
    • where possible, the envisaged period for which the personal data will be stored, or, if not possible, the criteria used to determine that period;
    • the existence of the right to request from the controller rectification or erasure of personal data, or restriction of processing of personal data concerning the data subject, or to object to such processing;
    • the existence of the right to lodge a complaint with a supervisory authority;
    • where the personal data are not collected from the data subject, any available information as to their source;
    • the existence of automated decision-making, including profiling, referred to in Article 22(1) and (4) of the GDPR and, at least in those cases, meaningful information about the logic involved, as well as the significance and envisaged consequences of such processing for the data subject.

    Furthermore, the data subject shall have a right to obtain information as to whether personal data are transferred to a third country or to an international organisation. Where this is the case, the data subject shall have the right to be informed of the appropriate safeguards relating to the transfer.

    If a data subject wishes to avail himself of this right of access, he or she may, at any time, contact any employee of the controller.

  • c) Right to rectification

    Each data subject shall have the right granted by the European legislator to obtain from the controller without undue delay the rectification of inaccurate personal data concerning him or her. Taking into account the purposes of the processing, the data subject shall have the right to have incomplete personal data completed, including by means of providing a supplementary statement.

    If a data subject wishes to exercise this right to rectification, he or she may, at any time, contact any employee of the controller.

  • d) Right to erasure (Right to be forgotten)

    Each data subject shall have the right granted by the European legislator to obtain from the controller the erasure of personal data concerning him or her without undue delay, and the controller shall have the obligation to erase personal data without undue delay where one of the following grounds applies, as long as the processing is not necessary:

    • The personal data are no longer necessary in relation to the purposes for which they were collected or otherwise processed.
    • The data subject withdraws consent to which the processing is based according to point (a) of Article 6(1) of the GDPR, or point (a) of Article 9(2) of the GDPR, and where there is no other legal ground for the processing.
    • The data subject objects to the processing pursuant to Article 21(1) of the GDPR and there are no overriding legitimate grounds for the processing, or the data subject objects to the processing pursuant to Article 21(2) of the GDPR.
    • The personal data have been unlawfully processed.
    • The personal data must be erased for compliance with a legal obligation in Union or Member State law to which the controller is subject.
    • The personal data have been collected in relation to the offer of information society services referred to in Article 8(1) of the GDPR.

    If one of the aforementioned reasons applies, and a data subject wishes to request the erasure of personal data stored by the Martin Luther University Halle-Wittenberg, he or she may, at any time, contact any employee of the controller. An employee of Martin Luther University Halle-Wittenberg shall promptly ensure that the erasure request is complied with immediately.

    Where the controller has made personal data public and is obliged pursuant to Article 17(1) to erase the personal data, the controller, taking account of available technology and the cost of implementation, shall take reasonable steps, including technical measures, to inform other controllers processing the personal data that the data subject has requested erasure by such controllers of any links to, or copy or replication of, those personal data, as far as processing is not required. An employees of the Martin Luther University Halle-Wittenberg will arrange the necessary measures in individual cases.

  • e) Right of restriction of processing

    Each data subject shall have the right granted by the European legislator to obtain from the controller restriction of processing where one of the following applies:

    • The accuracy of the personal data is contested by the data subject, for a period enabling the controller to verify the accuracy of the personal data.
    • The processing is unlawful and the data subject opposes the erasure of the personal data and requests instead the restriction of their use instead.
    • The controller no longer needs the personal data for the purposes of the processing, but they are required by the data subject for the establishment, exercise or defence of legal claims.
    • The data subject has objected to processing pursuant to Article 21(1) of the GDPR pending the verification whether the legitimate grounds of the controller override those of the data subject.

    If one of the aforementioned conditions is met, and a data subject wishes to request the restriction of the processing of personal data stored by the Martin Luther University Halle-Wittenberg, he or she may at any time contact any employee of the controller. The employee of the Martin Luther University Halle-Wittenberg will arrange the restriction of the processing.

  • f) Right to data portability

    Each data subject shall have the right granted by the European legislator, to receive the personal data concerning him or her, which was provided to a controller, in a structured, commonly used and machine-readable format. He or she shall have the right to transmit those data to another controller without hindrance from the controller to which the personal data have been provided, as long as the processing is based on consent pursuant to point (a) of Article 6(1) of the GDPR or point (a) of Article 9(2) of the GDPR, or on a contract pursuant to point (b) of Article 6(1) of the GDPR, and the processing is carried out by automated means, as long as the processing is not necessary for the performance of a task carried out in the public interest or in the exercise of official authority vested in the controller.

    Furthermore, in exercising his or her right to data portability pursuant to Article 20(1) of the GDPR, the data subject shall have the right to have personal data transmitted directly from one controller to another, where technically feasible and when doing so does not adversely affect the rights and freedoms of others.

    In order to assert the right to data portability, the data subject may at any time contact any employee of the Martin Luther University Halle-Wittenberg.

  • g) Right to object

    Each data subject shall have the right granted by the European legislator to object, on grounds relating to his or her particular situation, at any time, to processing of personal data concerning him or her, which is based on point (e) or (f) of Article 6(1) of the GDPR. This also applies to profiling based on these provisions.

    The Martin Luther University Halle-Wittenberg shall no longer process the personal data in the event of the objection, unless we can demonstrate compelling legitimate grounds for the processing which override the interests, rights and freedoms of the data subject, or for the establishment, exercise or defence of legal claims.

    If the Martin Luther University Halle-Wittenberg processes personal data for direct marketing purposes, the data subject shall have the right to object at any time to processing of personal data concerning him or her for such marketing. This applies to profiling to the extent that it is related to such direct marketing. If the data subject objects to the Martin Luther University Halle-Wittenberg to the processing for direct marketing purposes, the Martin Luther University Halle-Wittenberg will no longer process the personal data for these purposes.

    In addition, the data subject has the right, on grounds relating to his or her particular situation, to object to processing of personal data concerning him or her by the Martin Luther University Halle-Wittenberg for scientific or historical research purposes, or for statistical purposes pursuant to Article 89(1) of the GDPR, unless the processing is necessary for the performance of a task carried out for reasons of public interest.

    In order to exercise the right to object, the data subject may contact any employee of the Martin Luther University Halle-Wittenberg. In addition, the data subject is free in the context of the use of information society services, and notwithstanding Directive 2002/58/EC, to use his or her right to object by automated means using technical specifications.

  • h) Automated individual decision-making, including profiling

    Each data subject shall have the right granted by the European legislator not to be subject to a decision based solely on automated processing, including profiling, which produces legal effects concerning him or her, or similarly significantly affects him or her, as long as the decision (1) is not is necessary for entering into, or the performance of, a contract between the data subject and a data controller, or (2) is not authorised by Union or Member State law to which the controller is subject and which also lays down suitable measures to safeguard the data subject's rights and freedoms and legitimate interests, or (3) is not based on the data subject's explicit consent.

    If the decision (1) is necessary for entering into, or the performance of, a contract between the data subject and a data controller, or (2) it is based on the data subject's explicit consent, the Martin Luther University Halle-Wittenberg shall implement suitable measures to safeguard the data subject's rights and freedoms and legitimate interests, at least the right to obtain human intervention on the part of the controller, to express his or her point of view and contest the decision.

    If the data subject wishes to exercise the rights concerning automated individual decision-making, he or she may, at any time, contact any employee of the Martin Luther University Halle-Wittenberg.

  • i) Right to withdraw data protection consent

    Each data subject shall have the right granted by the European legislator to withdraw his or her consent to processing of his or her personal data at any time.

    If the data subject wishes to exercise the right to withdraw the consent, he or she may, at any time, contact any employee of the Martin Luther University Halle-Wittenberg.